
An Amazon sales dashboard shows sales, units, traffic, conversion, and product performance. But the right Amazon dashboard depends on the question: demand belongs in Sales and Traffic reports, settlements belong in Payments, search behavior belongs in Brand Analytics, and profit needs costs that a sales report does not contain.
The underlying motive is reassurance. Revenue moved, so you want one screen to explain why. Seller Central gives you several reporting surfaces instead, and opening more tabs does not automatically produce a decision.
This guide uses a simpler path: spot the account-level change, separate traffic from conversion, find the ASIN responsible, check whether you are looking at sales, payout, or profit, and end with one action.
Which Amazon report answers which question?
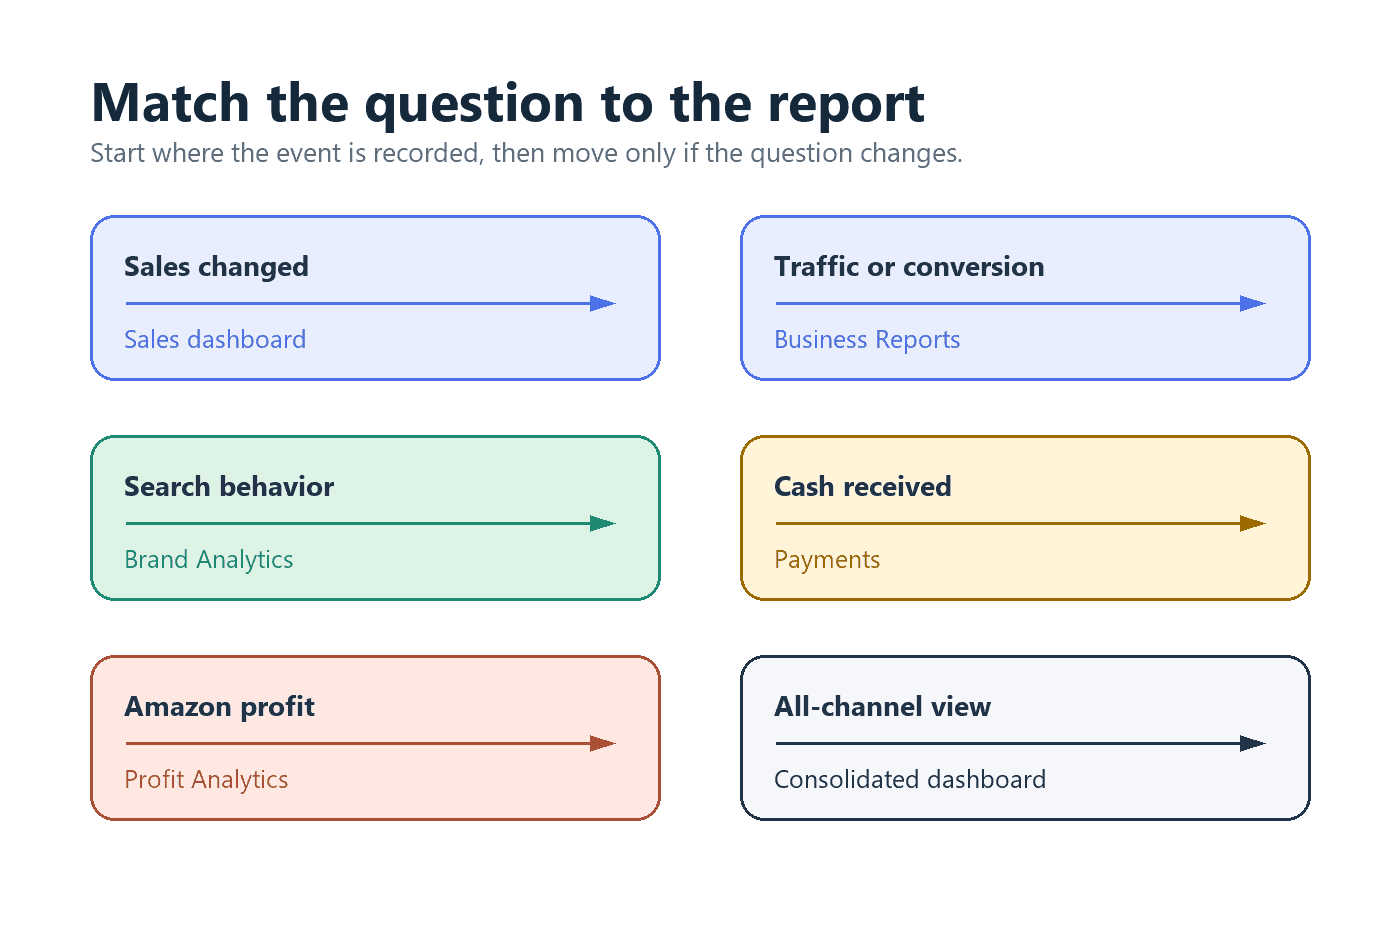
Each Amazon report has a narrower job than its name suggests. Use Sales and Traffic for demand, Brand Analytics for search and customer behavior, Payments for payouts, and ad reports for ad results. Add a profit or consolidated view only when the costs or channels you need sit outside those reports.
| Question | Best starting point | Important boundary |
|---|---|---|
| Did sales or units change? | Sales dashboard or Business Reports | Ordered sales are not cash received. |
| Did traffic or conversion change? | Sales and Traffic by Date or ASIN | Check matching dates and filters. |
| Which product caused the change? | By ASIN reports | Parent and child ASIN views can differ. |
| What are shoppers searching for? | Brand Analytics | Eligibility and data delays apply. |
| What will Amazon pay out? | Payments | Settlement timing differs from order timing. |
| Did ads drive profitable sales? | Amazon Ads plus cost data | Ad-attributed sales are not total profit. |
| What happened across stores or channels? | A consolidated analytics layer | Amazon remains the source for Amazon operations. |
The rule is simple: compare like with like, then move one level deeper only when the current report cannot explain the change.
What is an Amazon sales dashboard?
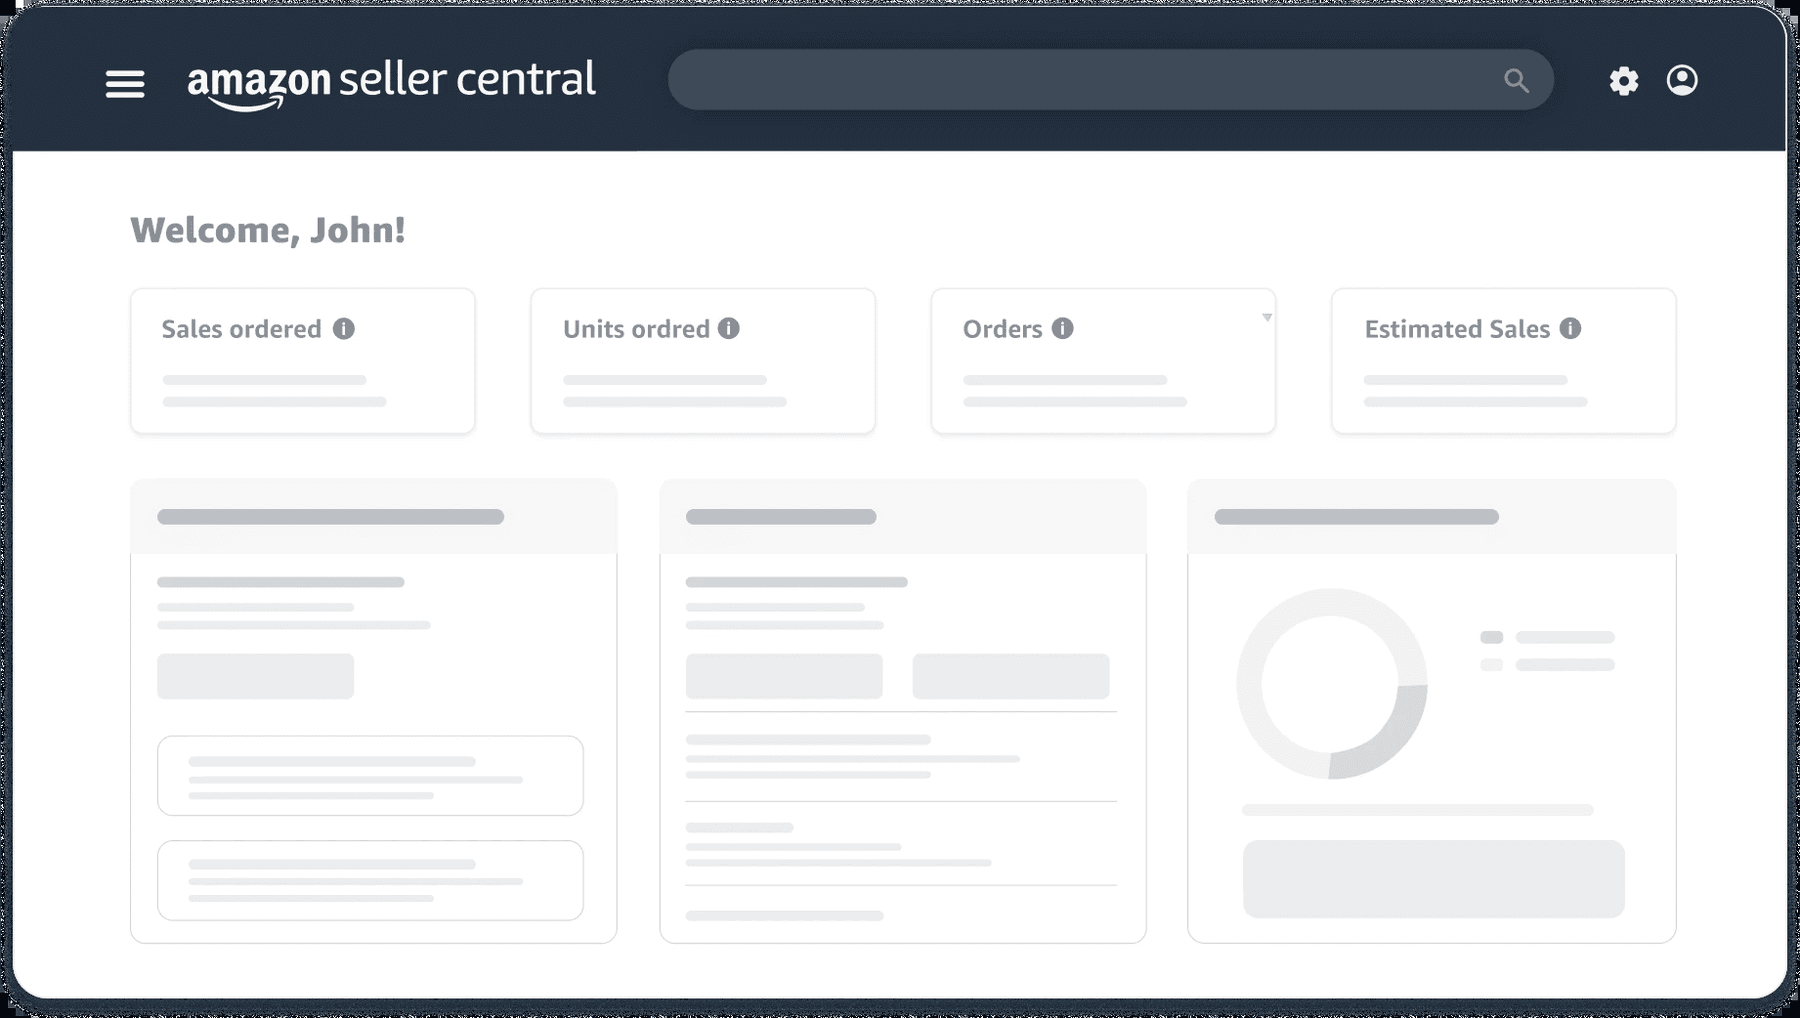
An Amazon sales dashboard is a Seller Central reporting view for checking ordered sales, units, traffic, conversion, and product performance over a selected period. The term often refers to the Sales dashboard inside Business Reports, though sellers may also use it loosely for Seller Central’s home-page sales overview.
Seller Central is a hub, not one all-purpose dashboard. Its separate sales, payments, ads, fulfillment, and brand reports measure different events.
The Sales dashboard is useful for questions such as:
- Did ordered product sales rise or fall?
- Did the change come from traffic or conversion?
- Which ASIN contributed most?
- How does this period compare with a similar one?
It cannot tell you net profit by itself. Fees, advertising costs, refunds, reserves, and cost of goods may sit in other reports or systems.
Where do you find the Amazon Sales dashboard?
The Amazon Sales dashboard is available in Seller Central under Reports > Business Reports. Amazon’s current seller-dashboard guide identifies Business Reports as the route to detailed sales data. If a navigation update hides the menu, use Seller Central search for “sales dashboard” as a temporary fallback.
What does the Amazon Sales dashboard show?
Amazon’s Sales dashboard brings together performance signals such as ordered sales, units, sessions, page views, conversion, and product-level results. The available columns and filters can vary by report, marketplace, and account, so read the visible report labels before comparing or exporting a figure.
What appears in the sales overview?
The sales overview answers the first question: what moved? It gives you a fast account-level view before you investigate traffic, conversion, or individual products.
What to look for:
- Ordered product sales
- Units ordered
- Order-item count, where shown
- Date range and comparison controls
Amazon’s examples compare today with yesterday, the same day last week, or the same day last year. Year-to-date performance can be compared with the prior year. Like-for-like periods reduce false alarms caused by a weekend, promotion, or partial day.
What do traffic and conversion reports show?
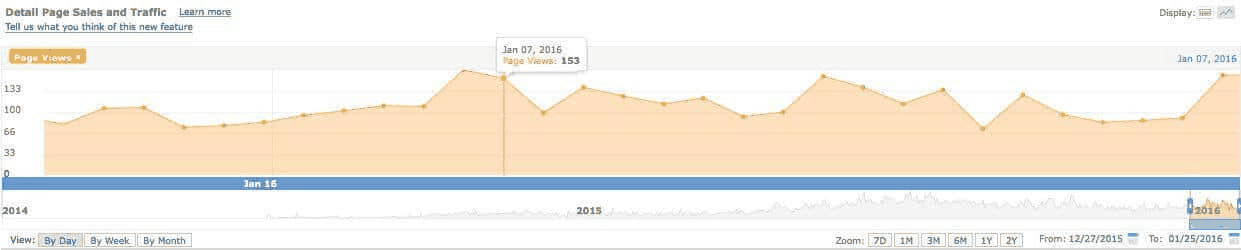
Traffic and conversion reports help separate a visibility problem from an offer problem. Falling sessions point toward discovery or demand. Stable traffic with a lower unit session percentage points toward the listing, price, availability, reviews, or offer conditions.
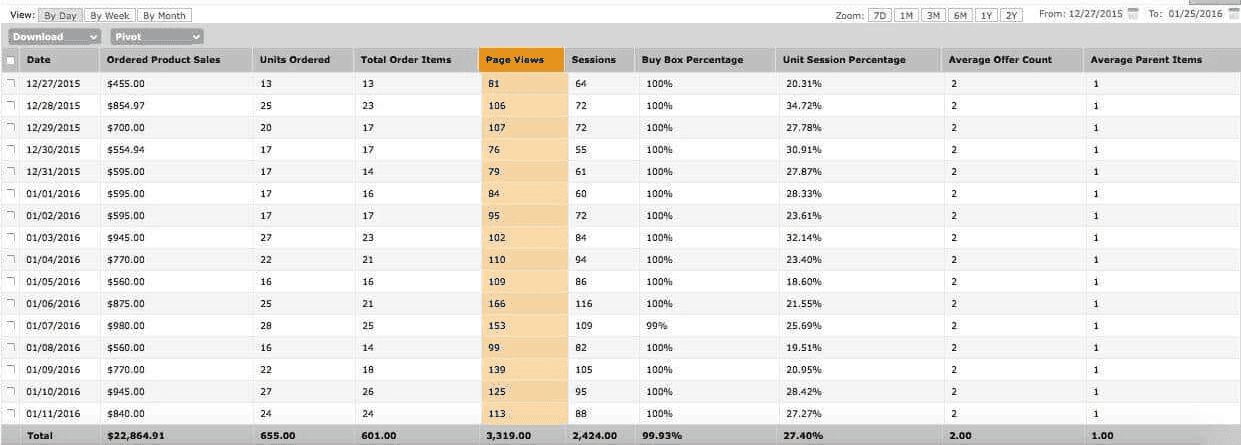
What to look for:
- Sessions or page views
- Unit session percentage
- Featured Offer percentage, where available
- Date and fulfillment-channel filters
A conversion drop means shoppers bought at a lower rate during that filtered period. Check the affected ASINs and offer conditions before naming the cause.
What do product and ASIN reports show?
Product and ASIN reports identify which listings caused the account-level movement. Amazon recommends week-over-week ASIN comparisons to find rising or declining sales, declining traffic, and performance below the market average shown in eligible reports.
What to look for:
- Parent and child ASIN views
- Sales and units by product
- Traffic and conversion changes
- Products gaining or losing contribution
Start with contribution. A 40% fall on a tiny ASIN may matter less than a 6% fall on a major product.
What does the B2B Sales dashboard show?
The B2B Sales dashboard separates Amazon Business activity where the account and marketplace support it. Amazon describes this B2B view as up to the hour. Other Seller Central reports can refresh on slower schedules.
What to look for:
- B2B sales
- Business orders or units
- Date comparisons
- B2B and non-B2B comparisons
Amazon says By Date Business Reports update hourly, while other reports may update daily. It also says Business Report history can extend up to two years. Check the report’s own definition before comparing a fresh order with a slower financial record.
Which Amazon dashboard should you use next?
The next dashboard should match the next unanswered question. Stay in Sales and Traffic while diagnosing demand and conversion. Move to Brand Analytics for eligible-brand search or customer behavior, Payments for cash movement, and advertising reports for campaign performance.
Use Sales and Traffic for demand and conversion
Use By Date reports to understand the account trend. Switch to By ASIN when you need the product behind that trend. Keep the marketplace, date range, and fulfillment filters consistent.
This is where product analytics helps isolate the products behind a revenue change. The useful unit is not “the account is down.” It is “traffic fell on these two high-contribution ASINs during the same comparison window.”
Use Brand Analytics for search and customer behavior
Brand Analytics is open to Brand Representatives of brands enrolled in Amazon Brand Registry who have a Professional selling account. Amazon says its data is generally available within three days, with quarter-end data typically available within one week, and historical coverage commonly extending three years.
Its dashboards include Search Query Performance, Search Catalog Performance, Top Search Terms, Repeat Purchase Behavior, Demographics, Market Basket Analysis, and Customer Loyalty Analytics. Use them for search, repeat-purchase, basket, and audience questions, not as substitutes for the booked-sales report.
Use Payments for settlements and cash movement
Payments answers what entered or left the Amazon settlement process. A sale placed today may ship, refund, incur fees, or settle on different dates, so its value may not line up with a Sales dashboard filtered by order date.
When numbers differ, ask which event each report records. “Which dashboard is wrong?” is usually the less useful question.
Use advertising reports for ad performance
Amazon Ads reports help connect spend with ad-attributed activity. They leave out organic sales, Amazon fees, refunds, fulfillment costs, and cost of goods, so they cannot show profit.
Keep attribution windows and filters visible when comparing ad reports with Seller Central totals. Two reports can include the same order under different rules.
Use Profit Analytics for Amazon-only profitability
Amazon’s Profit Analytics dashboard covers catalog profitability, including sales, advertising spend, refunds, returns, Amazon fees, and off-Amazon costs that you enter. Amazon places it under Reports > Selling Economics and Fees. Use it when the next question concerns Amazon-only margins.
Why do Amazon reports show different sales numbers?
Amazon reports can show different totals because they record different events, use different dates, apply different filters, and refresh on different schedules. Reconcile the report definition before adjusting the business. A Sales dashboard, a Payments statement, and a profit tool can all be correct within their own boundaries.
Check the event date
Order date, shipment date, refund date, and settlement date can fall in separate reporting periods. Start by writing down the exact event and date field used in each report.
Check the metric definition
Ordered product sales represent demand recorded under that report’s rules. A payout reflects money moving through Amazon’s payment process. Profit subtracts relevant costs.
Those are three different answers. Combining them under the word “sales” is how a five-minute check becomes an afternoon of spreadsheet archaeology.
Check the filters
Match the marketplace, currency, time zone, date range, fulfillment channel, and ASIN level. Parent-ASIN data can answer a different question from child-ASIN data, while a partial current day should not be compared with a complete previous day.
Check the update window
Business Reports, Payments, advertising, and external tools can each follow their own schedule.
If the newest transactions are missing, wait for the stated reporting window before treating the gap as an error. No single refresh time covers every Amazon report.
A sales dashboard is not a profit dashboard. Sales show demand. Profit appears only after the relevant fees, advertising costs, refunds, reserves, fulfillment expenses, and cost of goods are included.

How do you review an Amazon sales dashboard in 15 minutes?
A useful 15-minute review compares a matching period, separates traffic from conversion, locates the responsible ASIN, confirms the event boundary, and assigns one action. This is a suggested routine, not an Amazon feature.
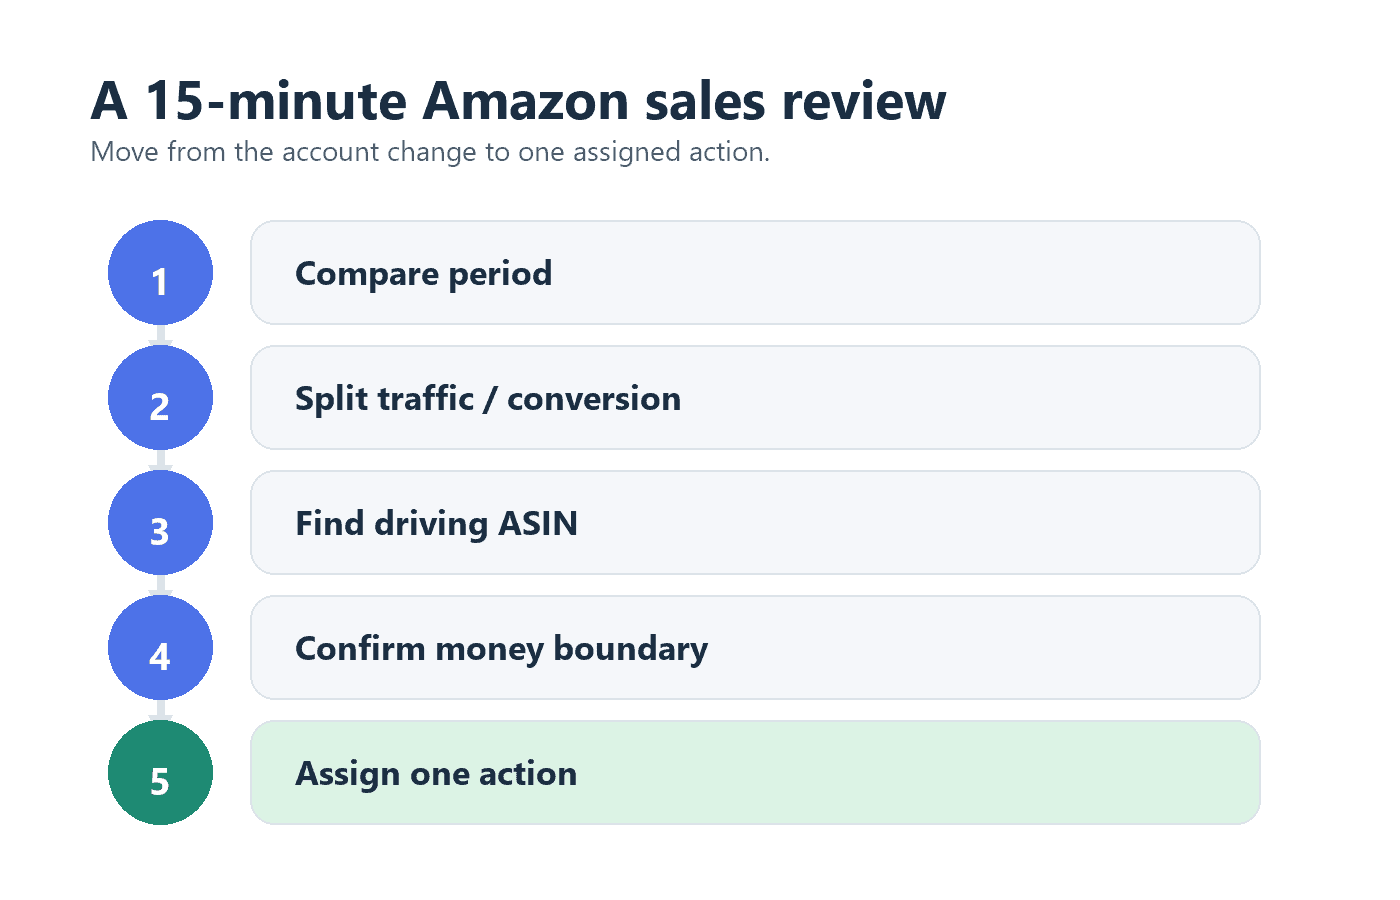
1. Ask what changed
Compare sales and units with a relevant period. Yesterday, the same weekday last week, and the same day last year answer different questions, so pick the comparison that matches the business cycle.
Avoid chasing a partial-day total. That is dashboard checking for reassurance, not analysis.
2. Separate traffic from conversion
If sales fell, check whether fewer people reached the listings or fewer visitors bought. Traffic directs you toward demand and visibility; conversion directs you toward the offer, listing, price, reviews, or stock position.
3. Find the ASIN that caused the movement
Sort products by absolute contribution to the change. Then inspect traffic and conversion for the few ASINs that account for most of the movement.
This keeps a small product’s dramatic percentage swing from hijacking the whole review.
4. Confirm whether it is sales, payout, or profit
Move to Payments when the question is cash received. Bring in fees, ad spend, refunds, and cost of goods when the question is profit.
Do not force Business Reports to become an accounting system. Use the report that owns the event.
5. Write down one action
Choose the smallest next step supported by the evidence:
- Investigate a traffic drop on a high-contribution ASIN.
- Test a listing or offer after a conversion decline.
- Check advertising spend behind a margin change.
- Reconcile a settlement against shipment and refund dates.
- Compare the same product across stores or marketplaces.
Give the action an owner and a review date. Otherwise, the dashboard becomes a very polished way to postpone a decision.
When is Amazon’s native dashboard enough?
Amazon’s native dashboards are enough when the decision stays inside one Amazon account and concerns Amazon sales, traffic, conversion, search, advertising, payments, or operations. Native reports remain the closest source for Amazon-specific definitions and should be checked before adding another reporting layer.
Use Seller Central alone when:
- One Amazon account contains the full sales picture.
- The question concerns Amazon-specific traffic, conversion, or ASIN performance.
- Payments, ads, fulfillment, or Account Health require their dedicated Amazon surfaces.
- An eligible brand needs Amazon search, basket, loyalty, or repeat-purchase data.
No seller needs another dashboard merely because another dashboard exists.
When do you need a consolidated sales dashboard?
A consolidated sales dashboard becomes useful when the decision crosses Amazon accounts, marketplaces, currencies, stores, or payment channels. It should reduce manual reconciliation and show a consistent business view without pretending to replace Amazon’s operational reports.
The alternative is often a spreadsheet chain: export orders, fees, and deposits, then tie Amazon activity to other platforms by hand.
Putler connects to Amazon Seller accounts in the North America, Europe, and Far East regions (setup guide). Its Amazon integration page says it opens the same reports to FBA and MFN sellers, shows multiple Amazon stores or accounts together or separately, removes duplicate transactions, and converts currencies into one dashboard.
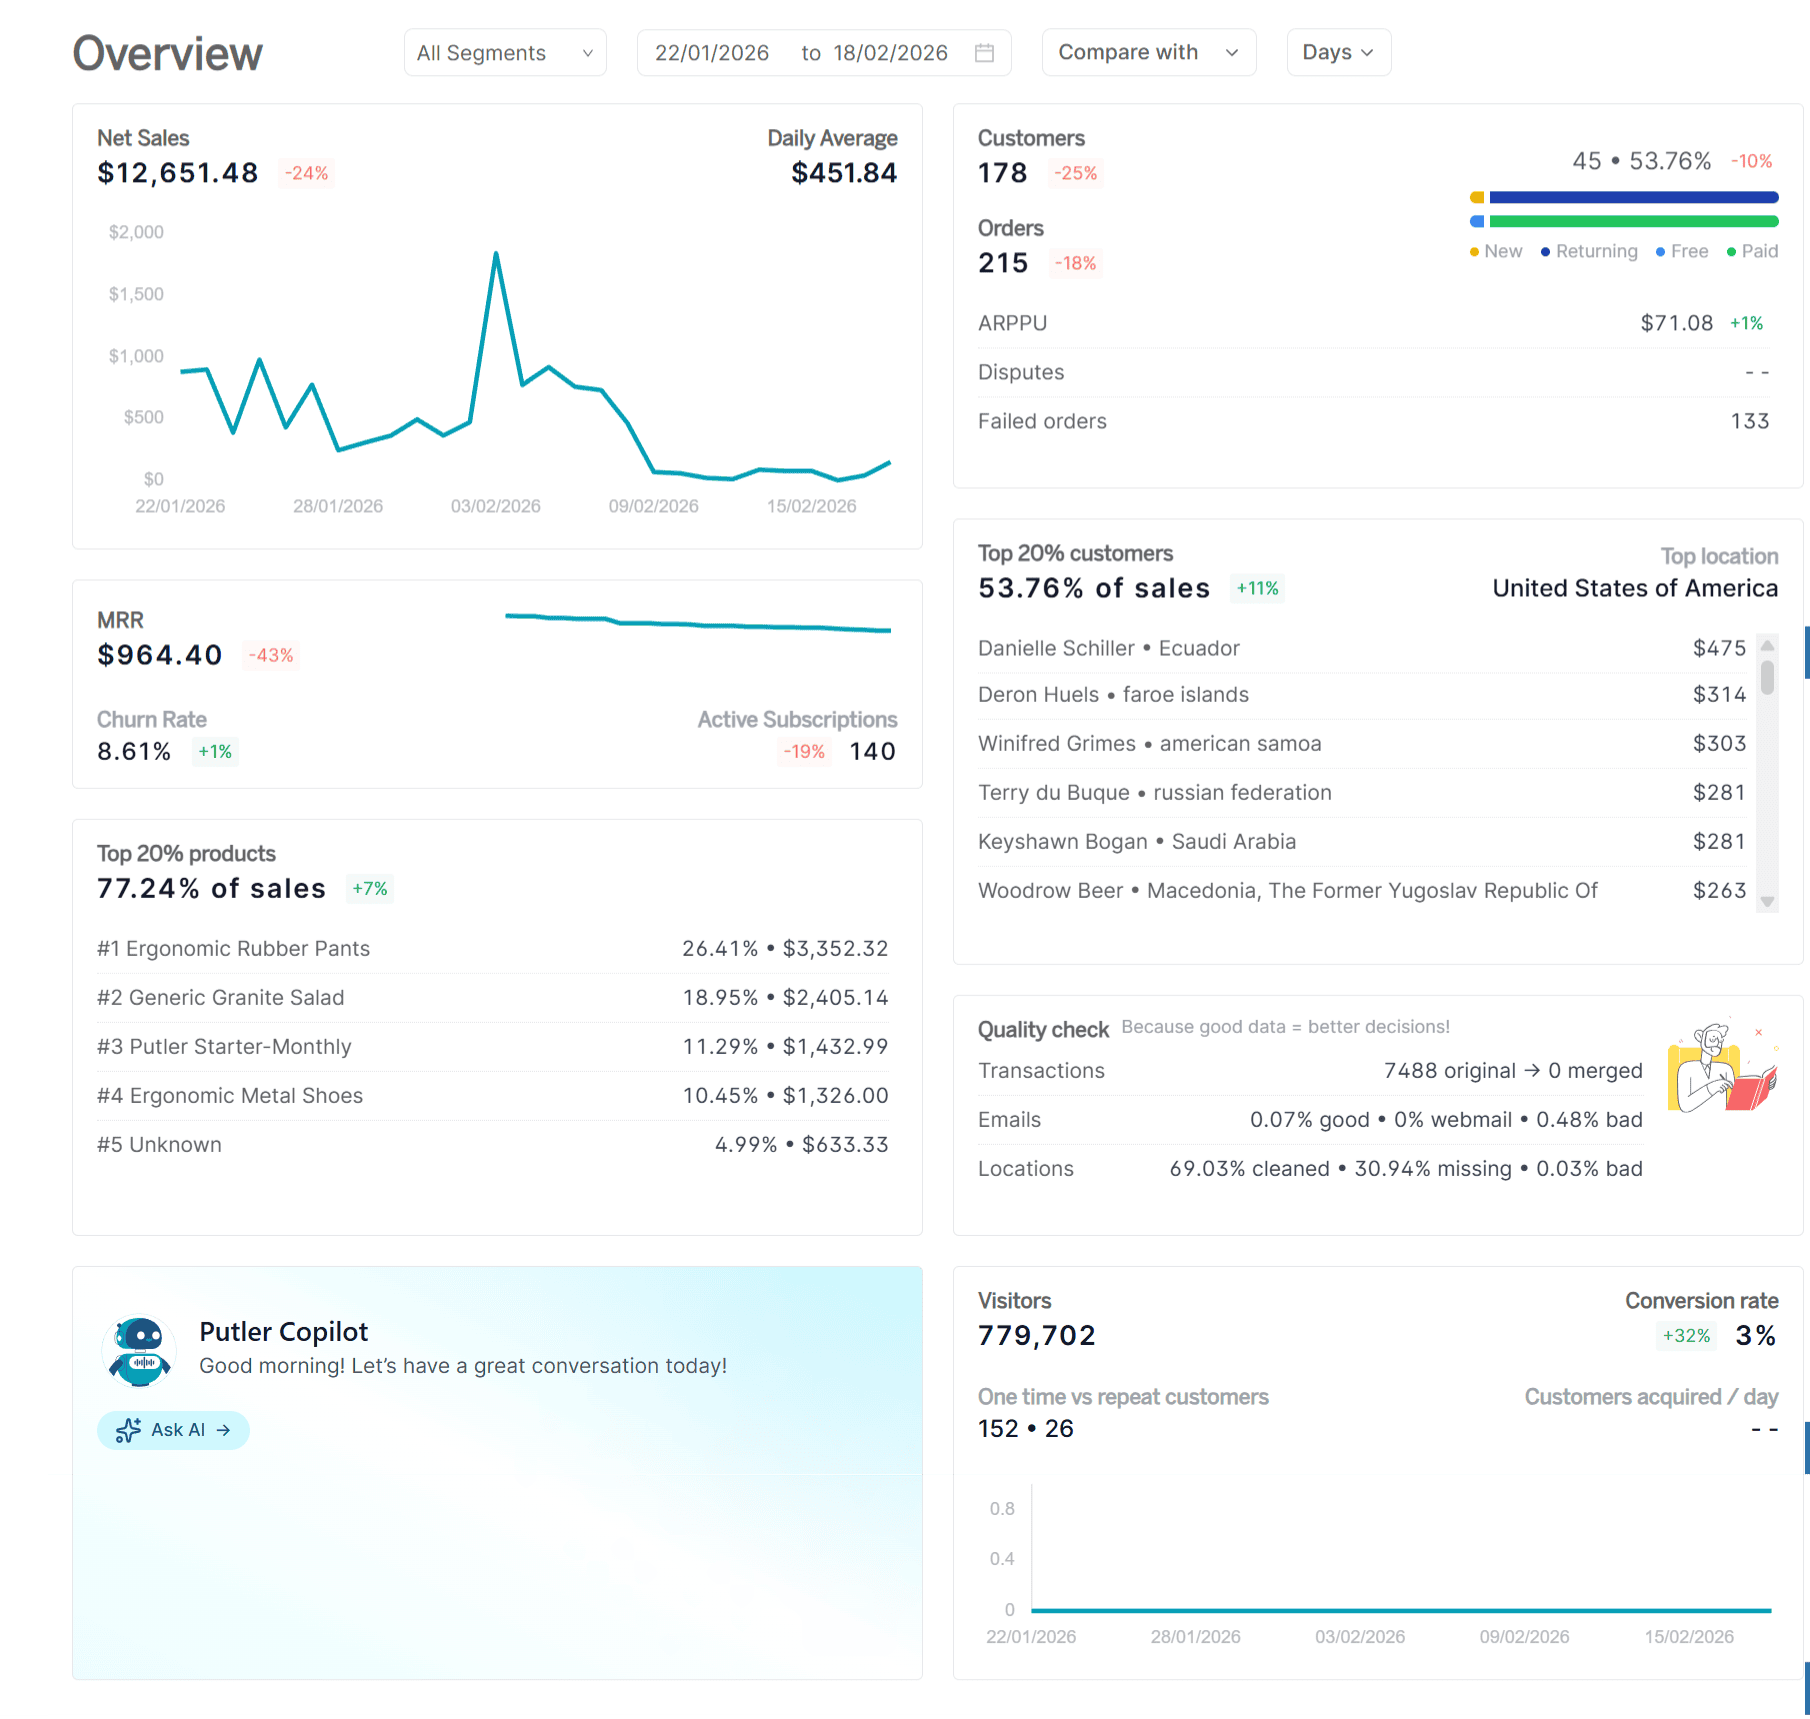
That makes a consolidated view useful for questions such as:
- What did the business sell across Amazon accounts and other stores?
- Which products drive revenue across channels?
- Which customers buy through more than one connected source?
- Are currency and duplicate-transaction issues distorting the total?
This is also where ecommerce analytics connects revenue across stores and customer analytics reveals value across purchase histories more usefully than another Seller Central tab.
The boundary matters. Putler does not replace Amazon’s fulfillment, tax, settlement, Account Health, Brand Analytics, or advertising tools. Before you rely on a specific Amazon field or refresh time, check it in your own connected account.
If manual exports are hiding the business-level answer, connect Amazon to Putler and test the same five-step review across the relevant stores and accounts.
Frequently asked questions about Amazon sales dashboards
What metrics are in the Amazon Sales dashboard?
Amazon Sales and Business Reports can include ordered product sales, units, order items, sessions, page views, unit session percentage, Featured Offer percentage, and ASIN-level performance. Available columns vary by report and account. Check the visible field definition before comparing, exporting, or reconciling a number.
How often does Amazon Business Reports data update?
Amazon says By Date Business Reports update hourly, while other reports may update daily. It describes the B2B Sales dashboard as up to the hour. Those timings are report-specific, not one promise for every Seller Central surface, so check the named report before diagnosing missing recent activity.
Why does Amazon Payments not match the Sales dashboard?
Payments and the Sales dashboard may use different events and dates. Ordered sales can be recorded before shipment, refund, fees, reserves, or settlement activity reaches the payment record. Match the date field, marketplace, currency, and filters before treating a difference as an error.
Does Amazon have a profit dashboard?
Yes. Amazon offers Profit Analytics in Seller Central under Reports > Selling Economics and Fees. It covers catalog profitability using sales, advertising spend, refunds, returns, Amazon fees, and off-Amazon costs that you enter. Check the included cost types before relying on the resulting margin.
Can I combine multiple Amazon accounts in one dashboard?
Amazon reports are usually reviewed within their Seller Central account and marketplace context. A consolidated analytics tool can bring multiple accounts or marketplaces into one business view. Keep Amazon’s native reports for operational detail, and verify the third-party tool’s supported regions, fields, and refresh rules.
What should you do next?
The goal is not more charts. It is one trustworthy answer and one next move.
Start inside Amazon. Open Business Reports, choose a like-for-like period, separate traffic from conversion, locate the ASIN behind the movement, and write down one action.
Use Brand Analytics when the next question concerns search or customer behavior. Move to Payments, ads, or cost data when the issue is cash or profit.
If the decision crosses Amazon accounts, currencies, or other sales channels, test the same review in a consolidated dashboard.