
This post does not talk about the Stripe company revenue. If you want to check Stripe revenue for 2025 and other statistics, refer here.
Instead, it talks about how Stripe users can monitor and grow their business (subscription and non-subscription).
Whether you run a WooCommerce, Shopify or BigCommerce store and have multiple Stripe accounts, you are at the right place.
So let’s see how to forecast and grow your Stripe revenue or sales of your business.
Why native Stripe reporting falls short
Let’s be honest. Stripe’s built in dashboard does a decent job for basic transaction tracking. You can see payments coming in, check for failed charges, and get a snapshot of your daily activity.
But here’s where things get tricky.
When your business starts growing and you need deeper insights, Stripe’s native reporting starts showing its limitations. You can’t easily consolidate data from multiple Stripe accounts into one view. Comparing performance across different time periods requires manual effort. And if you’re trying to understand customer behavior beyond their last transaction, you’ll find yourself hitting walls.
For businesses running on multiple platforms or using several payment gateways, this becomes even more challenging. Your Stripe reporting lives in one place, your PayPal data in another, and your eCommerce platform metrics somewhere else entirely.
That’s exactly why dedicated analytics tools exist. They bridge these gaps and give you the complete picture you need to make smarter decisions.
In-depth Stripe analytics and reports
Putler gives you detailed and comprehensive insights to track the revenue of your business keenly.
Connect your Stripe accounts to Putler to identify how your business is performing – whether the revenue is rising or falling, which products are sold the most, which customers made the highest purchases, are there any refunds…200+ metrics to identify growth opportunities.
Steps to connect Stripe to Putler:
- Once you sign in to Putler, click on the Stripe icon & give a name to this account.
- Log in to your Stripe account.
- Grant permission page appears – Click on grant permission.
- Your Stripe account has been added successfully to Putler.
As simple as that.
Let’s drill down to some dashboards for better understanding.
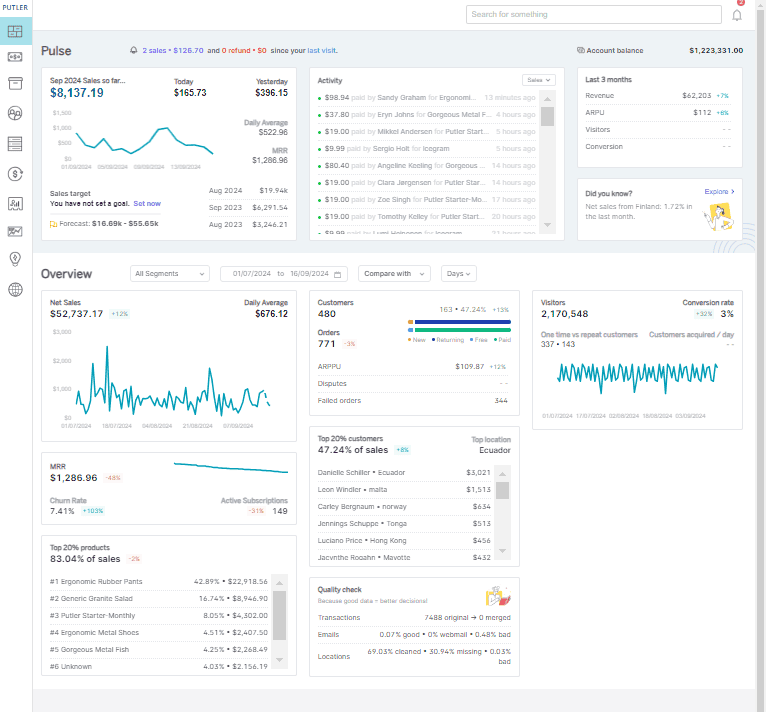
Sales dashboard (Stripe revenue dashboard)
This is actually the Putler Sales dashboard. But since we are only monitoring Stripe data for now, we can call it the Stripe revenue dashboard.
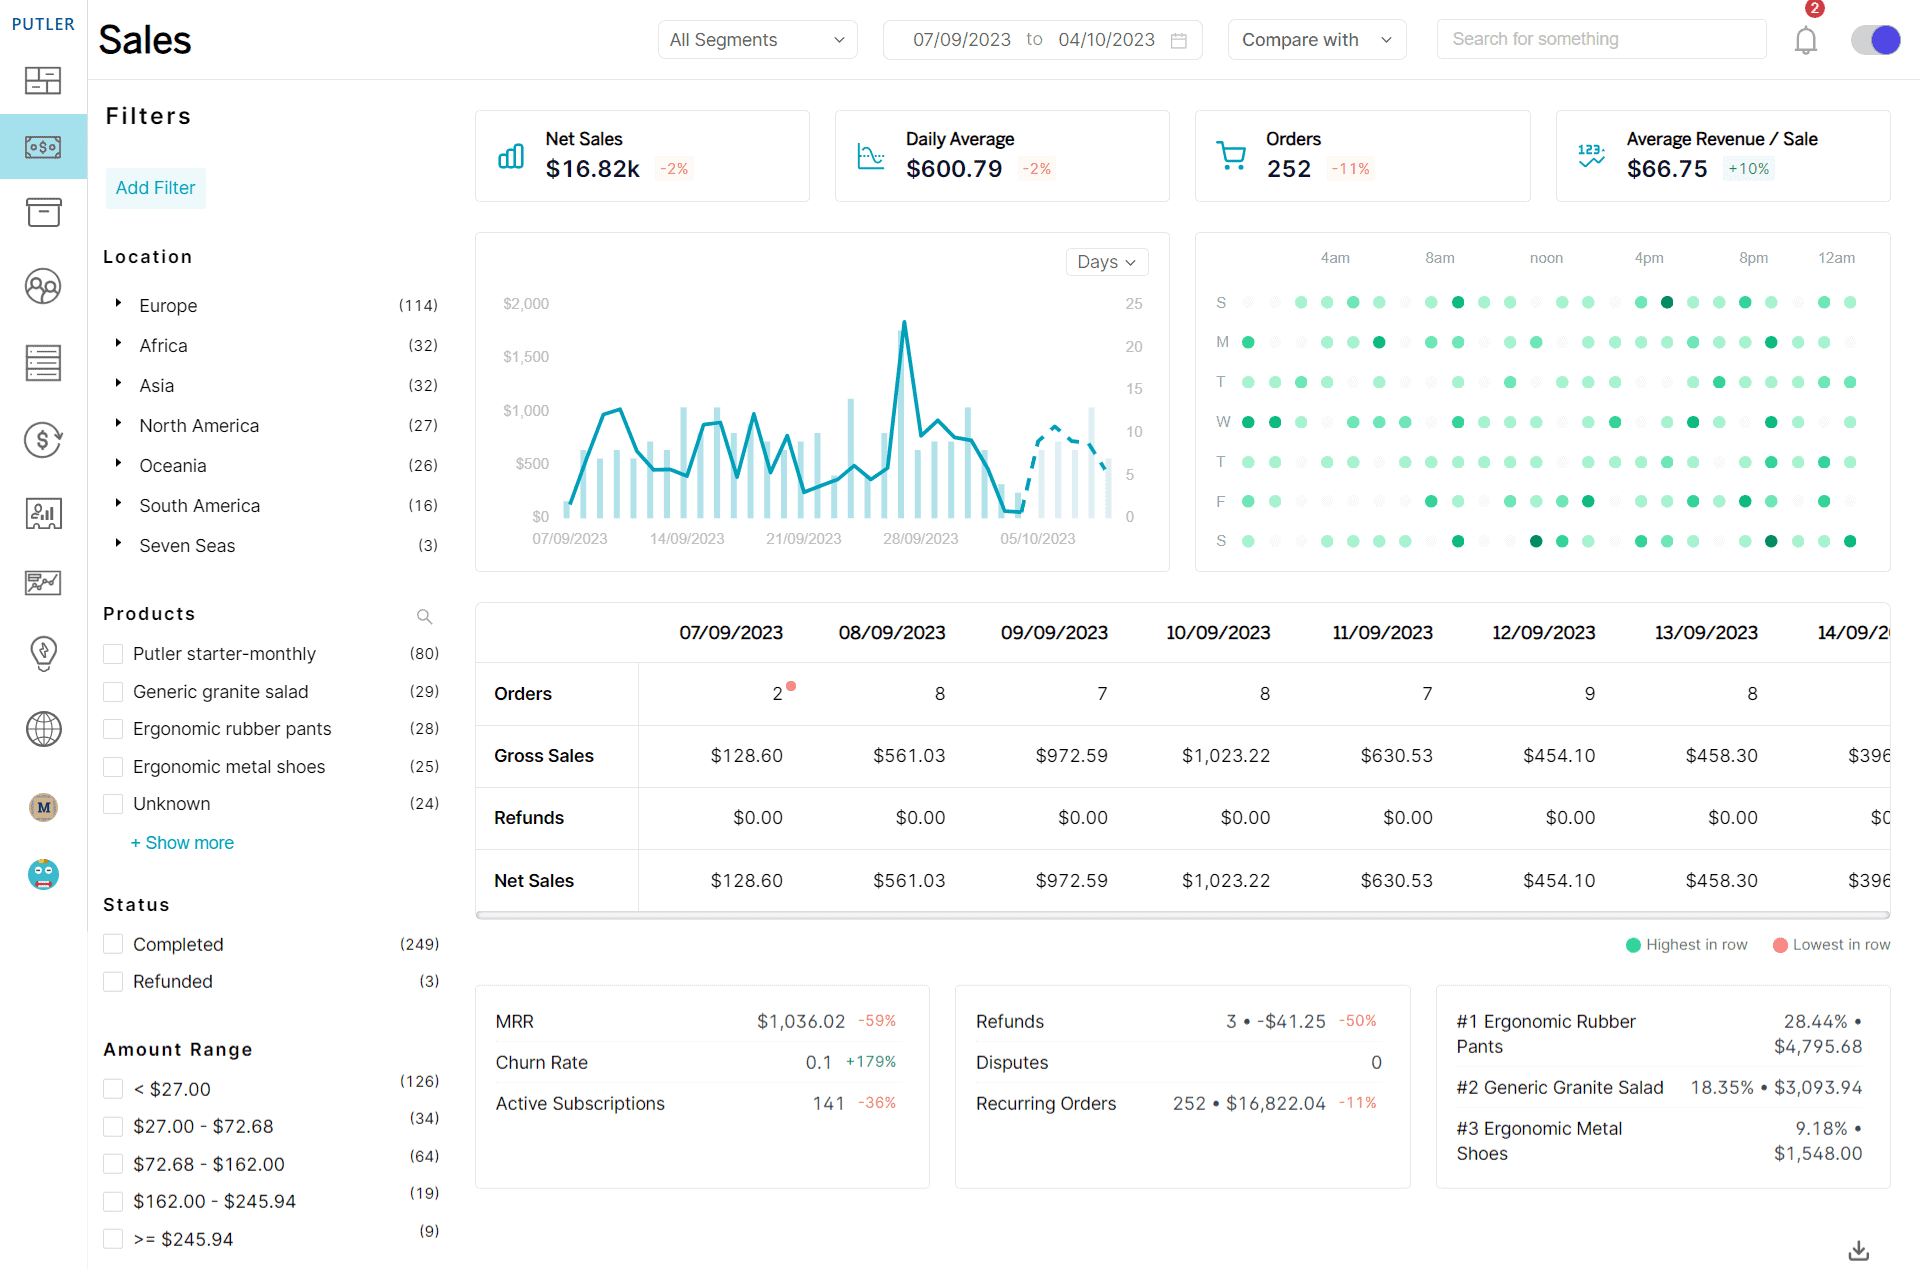
Here are some important revenue metrics you can analyze for business performance:
- Percentage change in sales (up or down) for the selected date range compared to the previous date range.
- Sales Heatmap – Indicates the best and worst day and the time you make sales. Darker the spots, the more the sales.
- Net sales and refunds
- Average revenue/sales
- Average revenue/day
- All your transactions list for the selected date range
With robust Stripe payment analytics, you get clarity on every transaction flowing through your business.
Products dashboard
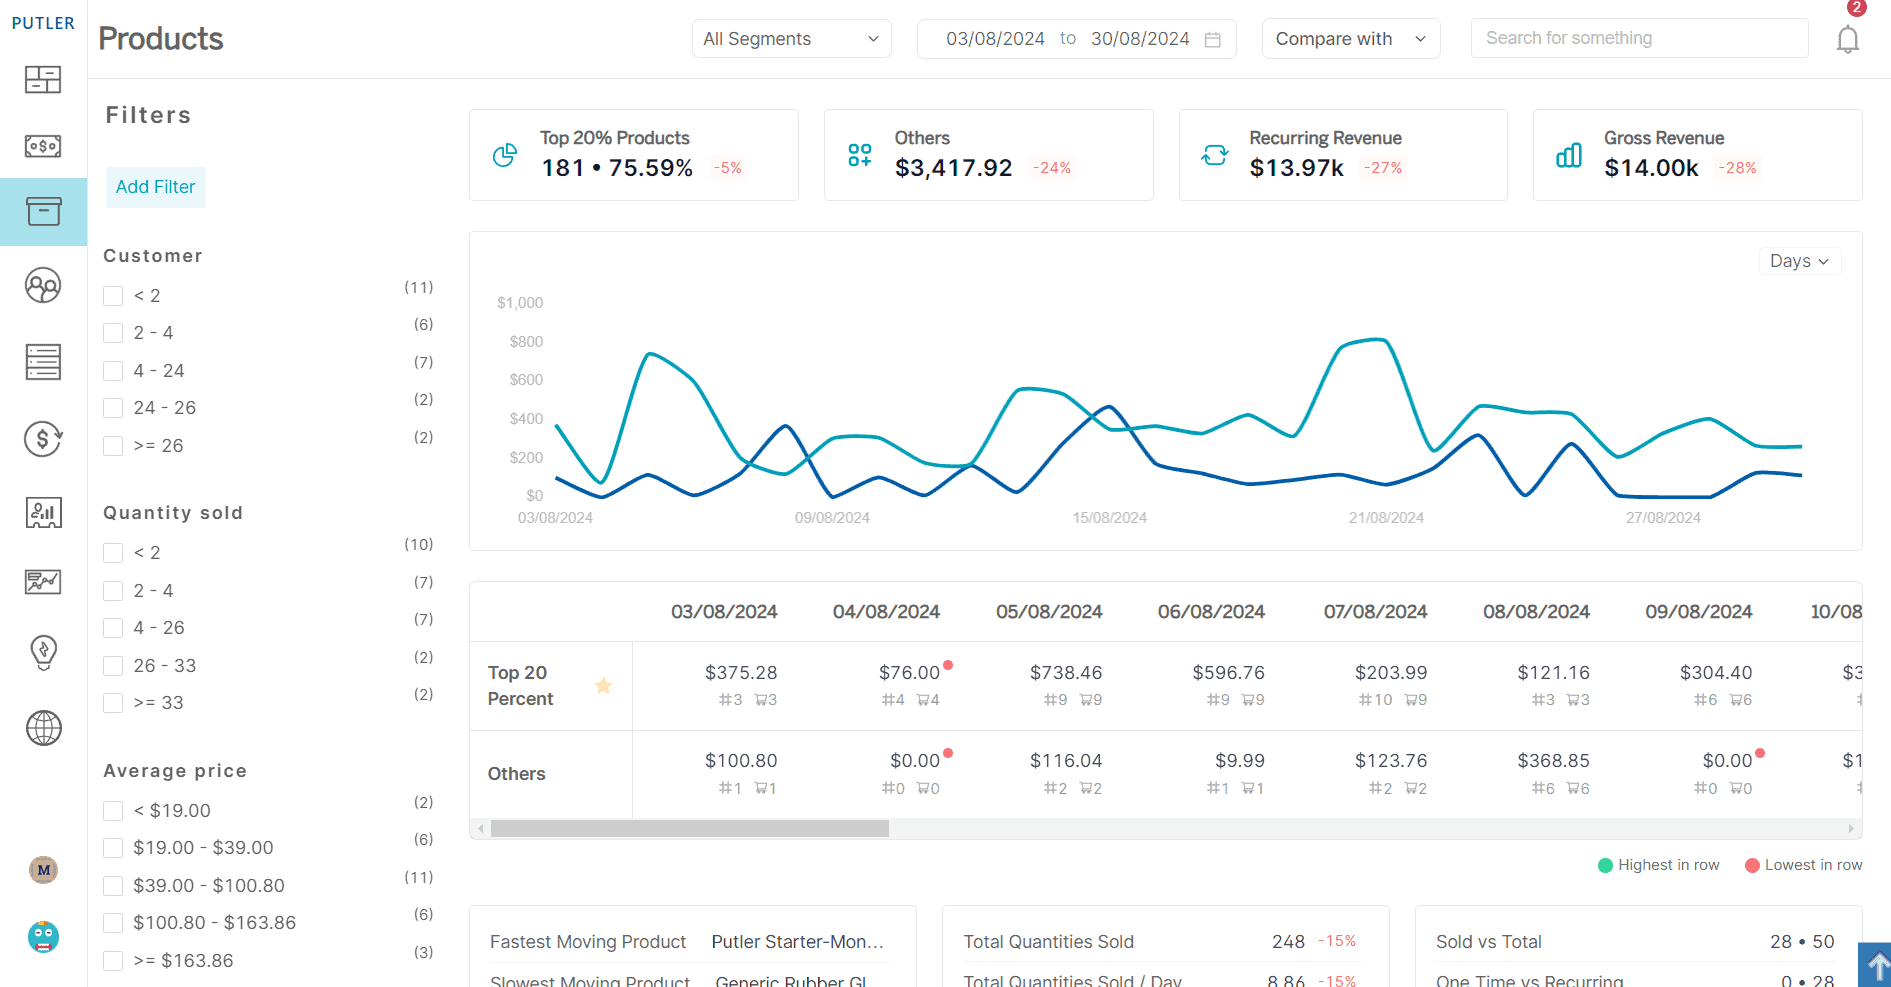
Get insights into your product performances to devise further marketing strategies.
- Product leaderboard – revenue from each product, orders placed, and customers who purchased those products.
- Fastest and slowest moving products
- Trending products on your store and products that have taken a hit
- Sales from the top 20% of products
- Refunded products
Customers dashboard
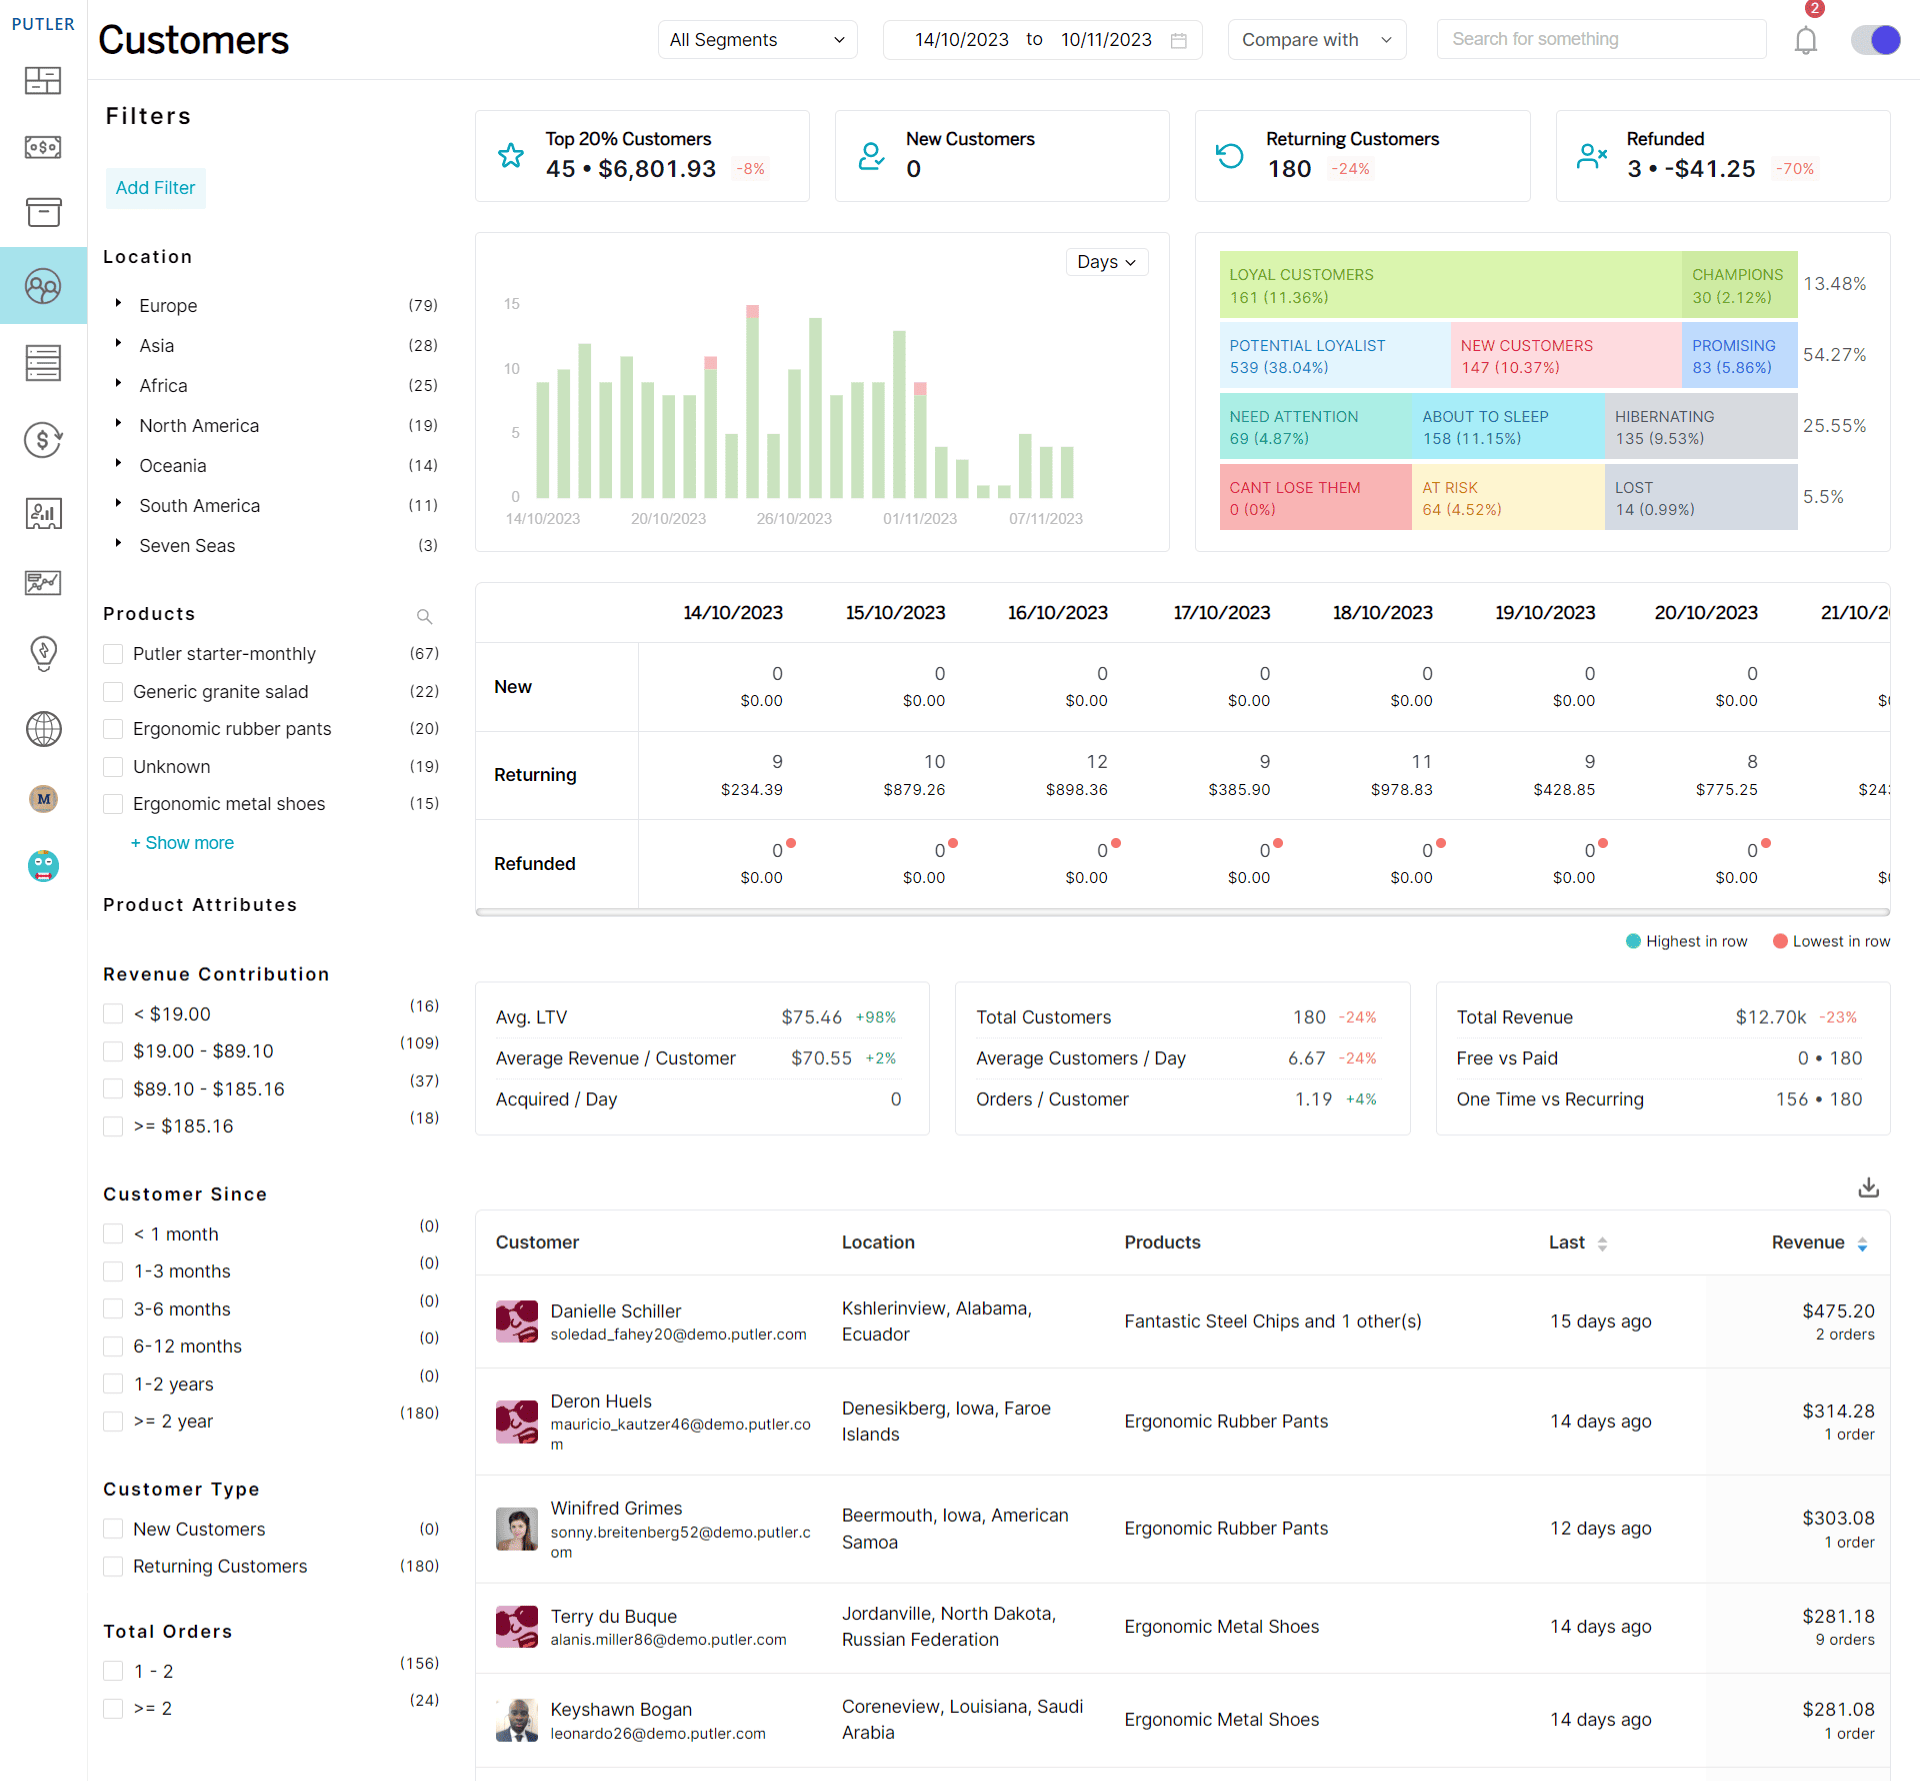
Gain some insights into your customer metrics to identify better targets for more sales.
- New vs returning customers
- RFM analysis – Customer segments to identify recent customers, their purchase frequency, and how much they spent. Best used for targeted email marketing.
- Individual customer profile – social media details, contact details, email address, geolocation, customer’s website information, list of products purchased.
- Average LTV, lost customers, top 20% customers, and other metrics.
Stripe subscriptions dashboard
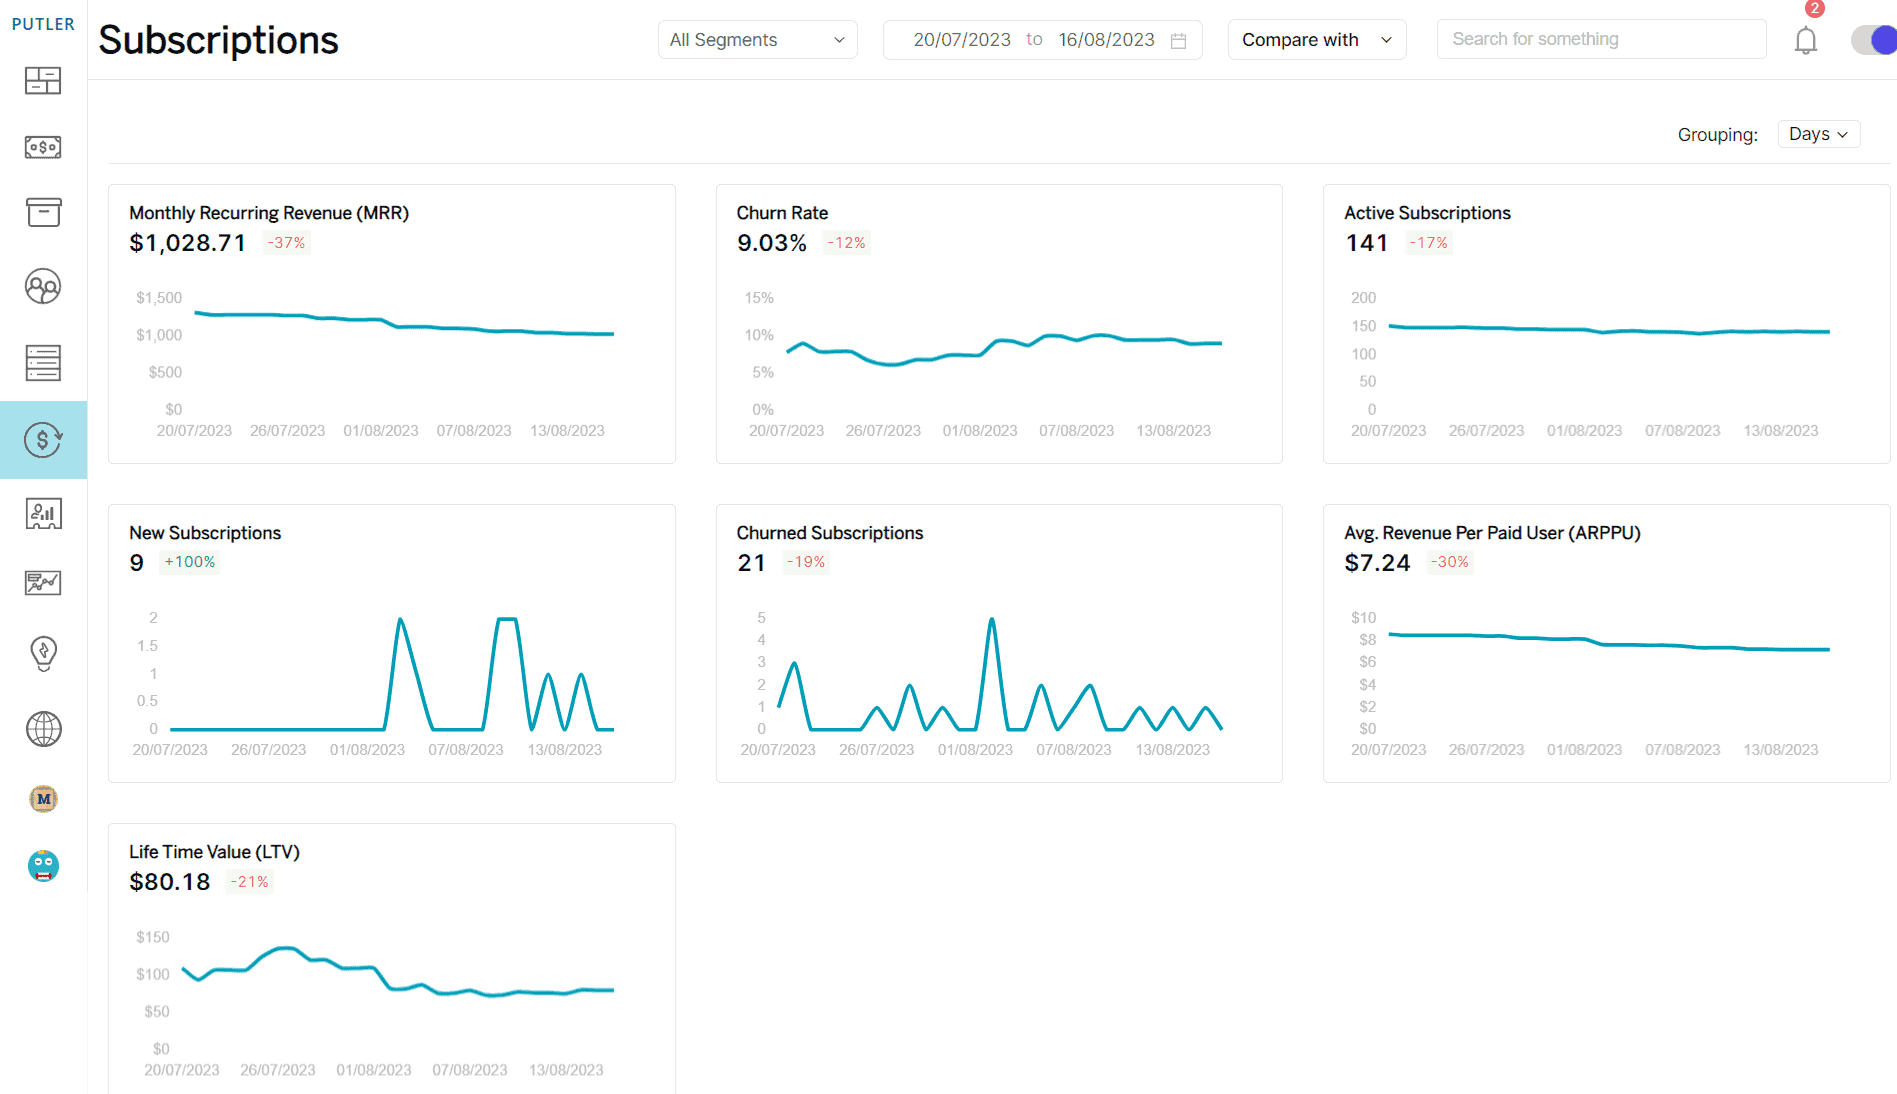
If you are running a subscription business, you can monitor the most important SaaS metrics for Stripe. MRR, churn rate, active, churned and new subscriptions, ARPPU and LTV.
Time machine to forecast your revenue
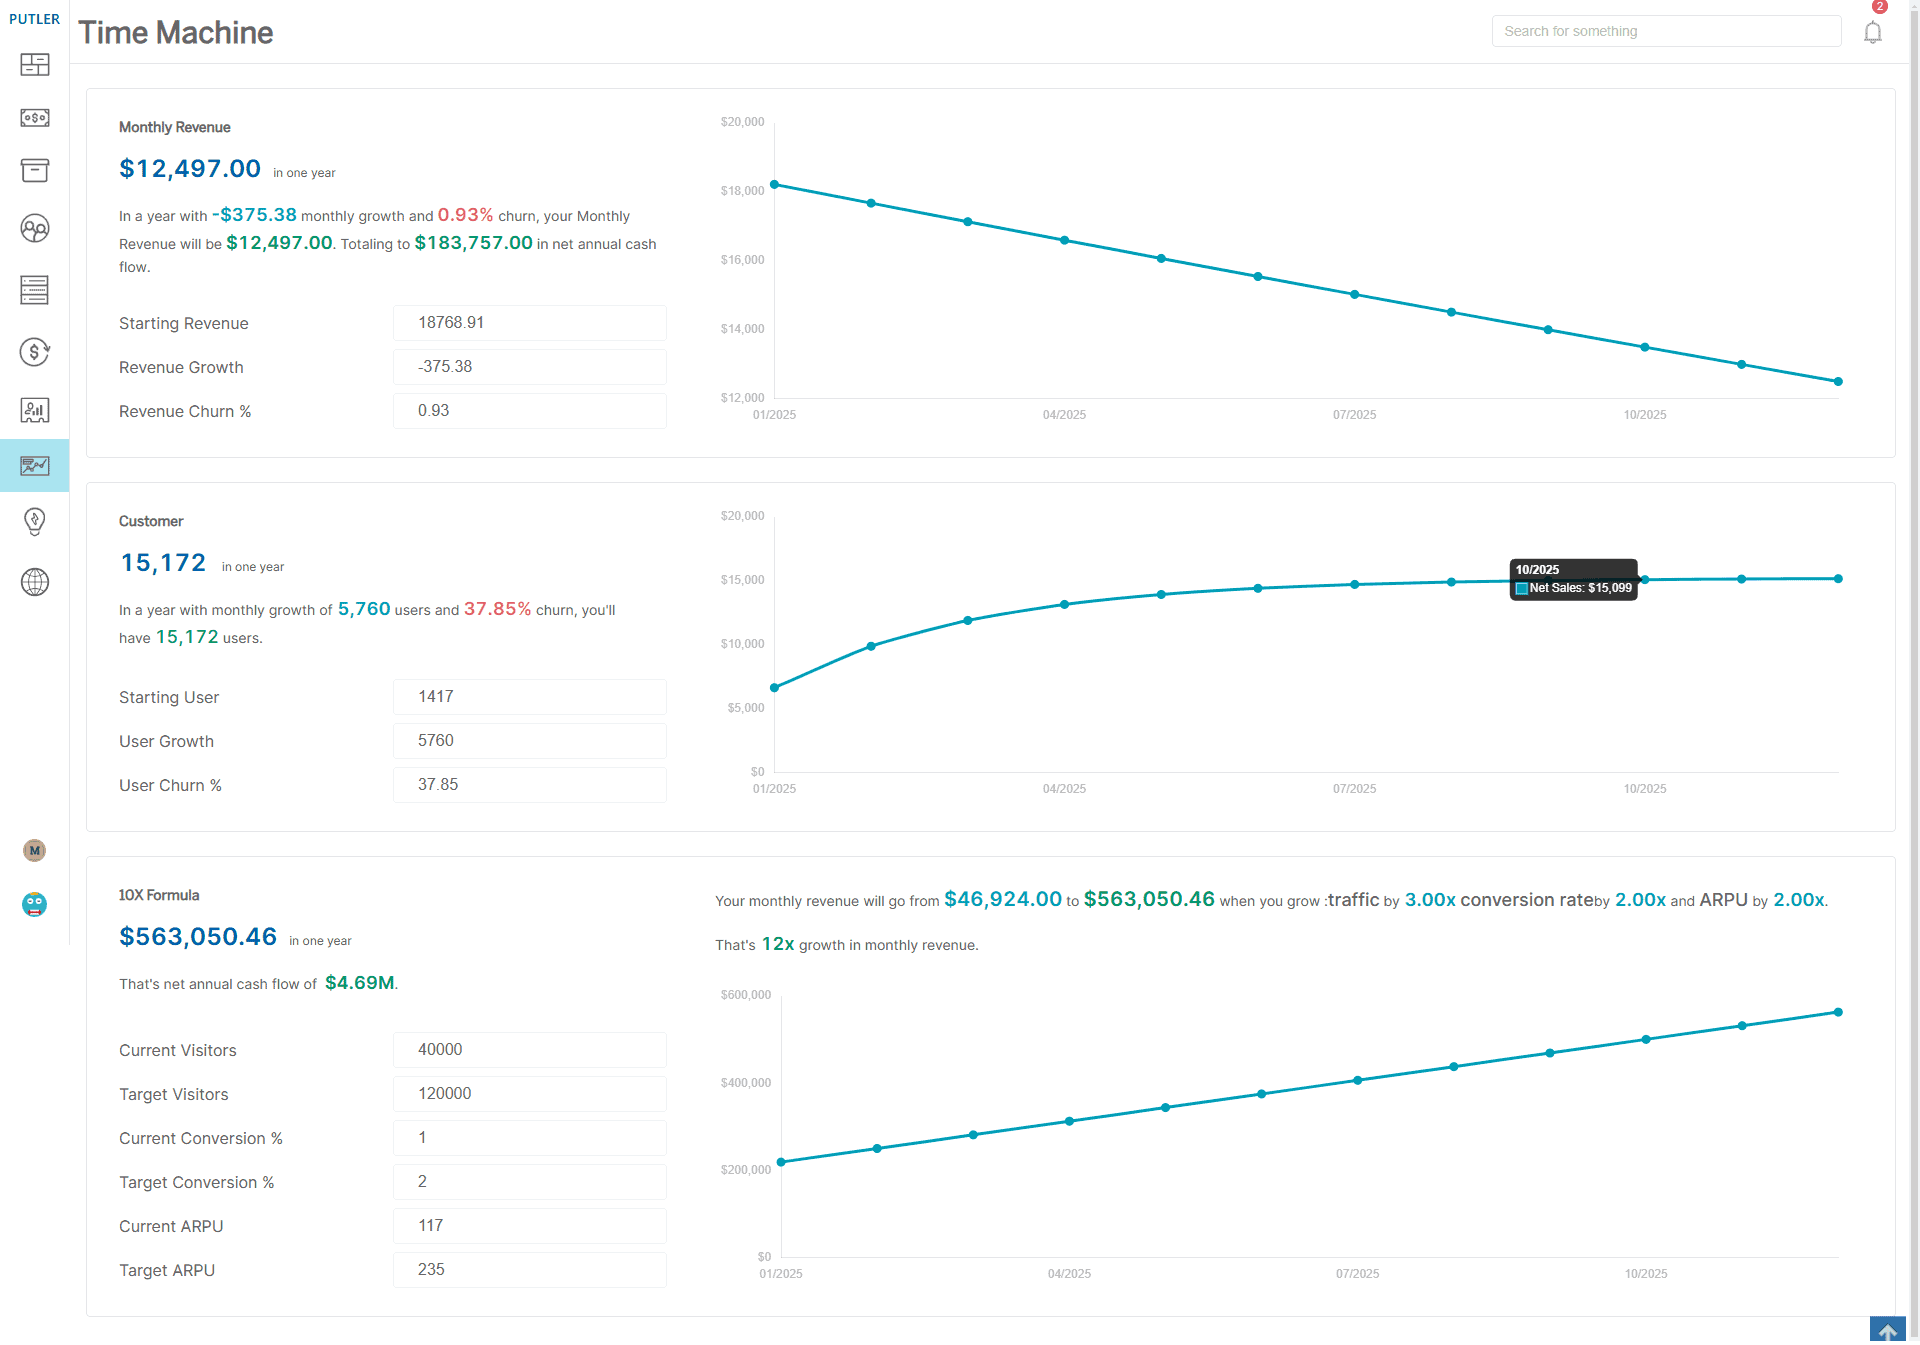
Based on your monthly revenue, Putler’s Time Machine model will forecast the monthly revenue you will earn at the end of 12 months.
This forecast is based on your monthly revenue growth and churn. On a similar line, the model will also forecast your customer count.
Not only Stripe, but you can also connect PayPal, WooCommerce, Shopify, and other platforms to Putler for advanced analytics and reports. If you’re using PayPal alongside Stripe, Putler’s PayPal analytics gives you the same depth of insights for that gateway too. View list of all integrations.
Another advantage of using Putler is you get accurate data in real-time. You can monitor data for individual data sources as well as combined ones.
Next steps
With so many important metrics mentioned above, you are now well-versed in identifying growth opportunities for your business and boosting your Stripe revenue with Putler.
FAQs
How does Putler help manage Stripe refunds?
Putler includes a refund filter that displays all refunded transactions in the Transactions dashboard.
You can also search for specific refunds using a customer’s name, email, or transaction ID.
Additionally, Putler allows you to issue full or partial refunds directly from the platform, simplifying the refund process.
What if I have multiple Stripe accounts?
Putler seamlessly integrates with multiple Stripe accounts, offering a unified view of your business performance in one place.
It also supports over 17 integrations, including PayPal, Razorpay, Braintree, and various other payment gateways and e-commerce platforms.
How does Putler forecast Stripe revenue?
Putler forecasts stripe revenue by analyzing your current monthly revenue, growth rate, and churn percentage.
It uses these factors to predict future monthly revenue and total annual cash flow, helping you plan for growth effectively.