
Extracting analytics can be a strenuous process for small businesses with limited resources. There’s a lot to consider: multiple stores, multiple payment gateways, multiple currencies, and multiple platforms.
Payment gateways provide much information regarding orders, sales, transactions, and revenue earned. Some even offer a certain level of insight that can help you with basic-level reporting. One of these, which is quickly gaining popularity, is the Razorpay payment gateway.
What is Razorpay?
Razorpay is an integrated online payments solution that lets your business accept, process, and disburse payments. It includes access to credit and debit cards, UPI, and mobile wallets for these payments.
Their product suite today comprises Payment Gateway, Payment Links, Payment Pages, Subscriptions, Smart Collect, Route, Razorpay Capital, RazorpayX, Payroll, and Thirdwatch, serving different business needs.
It handles several business-led transactions and provides various analytics for businesses to gather insights and improve their processes.
Razorpay analytics has various reports
While Razorpay provides several individual reports, we’ve focused on three categories.
Financial reports
Razorpay reporting provides these financial indicators –
- Orders: created when a customer clicks on the pay button
- Payments: made by customers for purchases
- Settlements: of money received from customers in your bank account
- Refunds: by customers for products or services purchased
- Combined: report includes payments, refunds, adjustments, and transfers
- Subscriptions: made by customers for the given period
QuickBooks reports
You can integrate your QuickBooks and Razorpay accounts for payment transactions. Via QuickBooks, you get several reports like –
- Lists: Give data on customers, employees, and suppliers without analysis
- Detail: Reports share transaction details with additional analysis
- Summary: Reports provide consolidated information on transactions
- Customized: Reports use several variables such as invoice line items, invoice number, amount, payment status, and more.
Custom reports
Razorpay reports provide a few customized dashboard graphs, such as –
- Traffic split: between desktop, mobile, and others by payment volume and number of payments
- Payment modes: split between debit cards, credit cards, bank transfers, UPI, and other platforms
- Customized date-range: reports for all financial transactions
Key metrics Razorpay doesn’t track
Razorpay excels at transaction processing, but its analytics dashboard misses several metrics that subscription and ecommerce businesses actually need to grow:
Customer lifetime metrics:
- LTV (Lifetime Value): The total revenue you can expect from a customer over their entire relationship with your business. Razorpay shows individual transactions, but won’t calculate them automatically.
- Customer Acquisition Cost (CAC): How much you spend to acquire each paying customer. Razorpay has no visibility into your marketing spend, so this metric is impossible to track natively.
- Average Revenue Per Customer: Razorpay shows total revenue and transaction counts, but doesn’t tie these to unique customer profiles over time.
Subscription health metrics:
- MRR (Monthly Recurring Revenue): For subscription businesses, this is the most critical number. Razorpay’s subscription reports show active subscriptions but don’t calculate normalized MRR across different billing cycles.
- Churn rate: The percentage of subscribers who cancel within a given period. Razorpay tracks cancellations but doesn’t express this as a rate or trend over time.
- Net Revenue Retention: Whether your existing customers are spending more or less over time. Razorpay has no mechanism to track expansion or contraction revenue.
Behavioral insights:
- Cohort analysis: How do customers acquired in January behave differently from those acquired in June? Razorpay doesn’t segment customers by acquisition period.
- Product affinity: Which products are frequently purchased together? Razorpay tracks individual transactions but doesn’t surface cross-sell patterns.
- RFM segmentation: Recency, Frequency, and Monetary analysis to identify your best and at-risk customers. This requires data processing that Razorpay simply doesn’t offer.
The core issue? Razorpay is built for payment processing, not business intelligence. It answers “what happened” but rarely “why” or “what should we do next.”
Razorpay pricing and fees breakdown
Understanding Razorpay’s fee structure helps you accurately calculate your true payment processing costs:
Standard transaction fees:
- Credit/Debit cards, UPI, wallets: 2% per transaction
- Premium cards (Amex, Diners, corporate cards): 3% per transaction
- International cards: 3% per transaction
- EMI transactions: 3% per transaction
- GST: 18% applicable on all transaction fees
Settlement cycles:
- Standard settlement is T+2 (two business days after the transaction)
- Instant settlements are available for additional fees
- Weekends and bank holidays extend settlement timelines
What’s free:
- No setup fees
- No annual maintenance charges
- No minimum transaction requirements
- Dashboard access and basic reporting
Volume-based pricing: Businesses processing more than ₹5,00,000 monthly can negotiate custom rates. High-volume merchants often secure rates between 1.5% to 1.8% for standard transactions.
Hidden cost considerations:
- Refunds: Razorpay refunds the transaction fee on full refunds, but partial refunds may not return proportional fees
- Chargebacks: Disputed transactions incur additional processing overhead
- Currency conversion: International payments involve forex markups beyond the stated 3%
For businesses comparing options, similar fee structures apply across PayPal and other gateways — the real cost difference often comes down to settlement speed and failed payment recovery.
But these Razorpay reports aren’t enough
Even though Razorpay analytics provides much information regarding your payments, it’s not helpful when planning marketing-sales activities and scaling your business.
Limitations of in-house Razorpay reporting
- Payment gateway reports are factual but do not provide actionable insights. This same challenge exists with PayPal reporting and other gateway-specific dashboards.
- There is no customer segmentation or product analytics to support marketing strategies.
- There’s no way to filter for individual payment types (captured or failed) across different payment pages or customers. Users have to switch between ‘payment links’ and ‘payment pages’ to view this information.
- Razorpay reporting doesn’t provide helpful filters to drill down into insights and extract customized details.
- Extracting information from reports for promotions is tedious. There’s no integration to send SMS or Email Messages to customers from within the dashboard.
- If you have multiple payment accounts, Razorpay payment gateway doesn’t let you review and analyze consolidated data for all of them, either.
Now let’s jump into common mistakes.
Common Razorpay reporting mistakes
Even experienced finance teams make these errors when working with Razorpay data. Avoiding them keeps your numbers accurate:
Not reconciling settlements with bank statements
Razorpay’s settlement reports show what should have hit your bank account, but discrepancies happen. Bank processing delays, rejected transfers, and partial settlements can create gaps between Razorpay’s numbers and your actual bank balance. Reconcile weekly, not monthly.
Ignoring failed payment patterns
Razorpay tracks failed payments, but most businesses never analyze them. A sudden spike in failures from a specific bank or card type often indicates technical issues or fraud patterns. Check your failed payment report at least monthly — it’s hidden gold for improving conversion rates.
Missing refund trends
Individual refunds feel routine, but patterns reveal problems. If refunds spike for specific products, time periods, or customer segments, you have a product or fulfillment issue. Razorpay won’t surface these trends automatically — you need to export and analyze the data yourself.
Confusing captured vs. settled amounts
A payment can be “captured” (authorized and charged) but not yet “settled” (transferred to your bank). Reporting on captured amounts gives you an inflated view of available cash. Always verify settlement status before making cash flow decisions.
Treating all transactions as equal
A ₹500 transaction and a ₹50,000 transaction both count as “one payment” in Razorpay’s transaction count. High-value transactions deserve more attention — a single failed high-ticket payment can impact revenue more than dozens of successful small ones. Segment your analysis by transaction value.
Not tracking fee leakage
Razorpay fees vary by payment method and card type. If your customers increasingly use premium cards or international payments, your effective fee rate creeps up without any dashboard alert. Track fees as a percentage of revenue monthly.
There are alternatives!
Growing your eCommerce business is always one of the forefront goals. And while Razorpay reports provide limited help, some applications are built solely to empower you.
Just as businesses using Stripe benefit from dedicated Stripe payment analytics tools, Razorpay users need purpose-built solutions that go beyond basic transaction data.
Putler is one such platform. It provides consolidated and powerful analytics for all your stores, payment gateways, and Google Analytics in one single application. From product insights to customer segmentation, the platform has everything you could ask for:
- One-stop dashboard for all your stores combined as well as individually
- Multiple payment gateways, including advanced Razorpay analytics
- Multi-currency, multi-team support
- In-depth customer insights in real-time
- Product management and cataloging
- Sales trends, transaction breakups, and drill-downs
- Subscription metrics and reporting
- Google analytics
- Advanced filters on products, orders, locations, customers, and more
- Custom time-period extracts
- Availability of historical data
Get the best out of Razorpay reporting with Putler
Listed below are all the additional insights you get with Putler and how they’re beneficial for business.
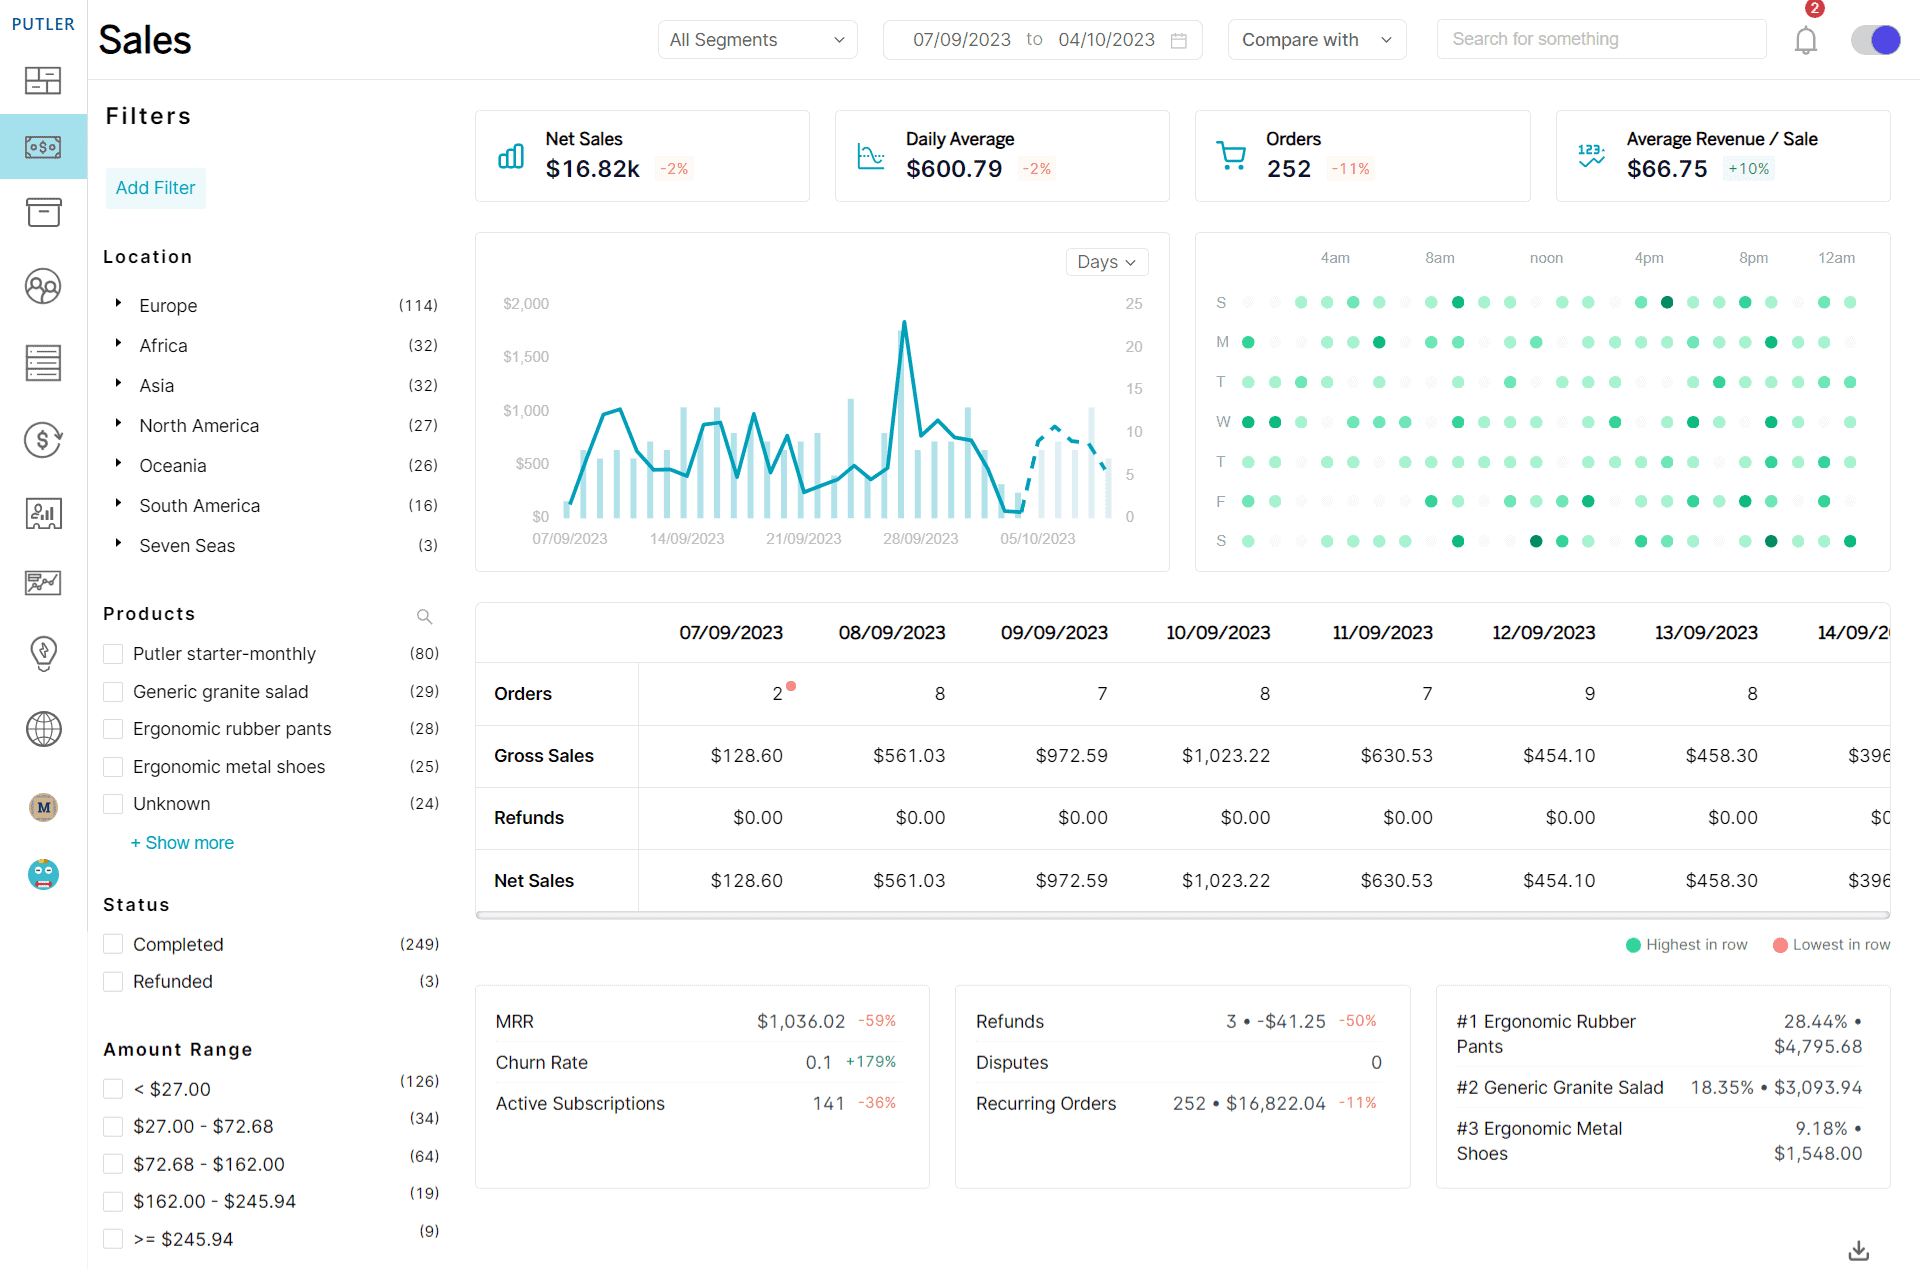
Data consolidation
Our dashboard aggregates data from multiple stores and payment gateways, including multiple Razorpay accounts, in one place. You can check overall sales as well as individual store and payment information.
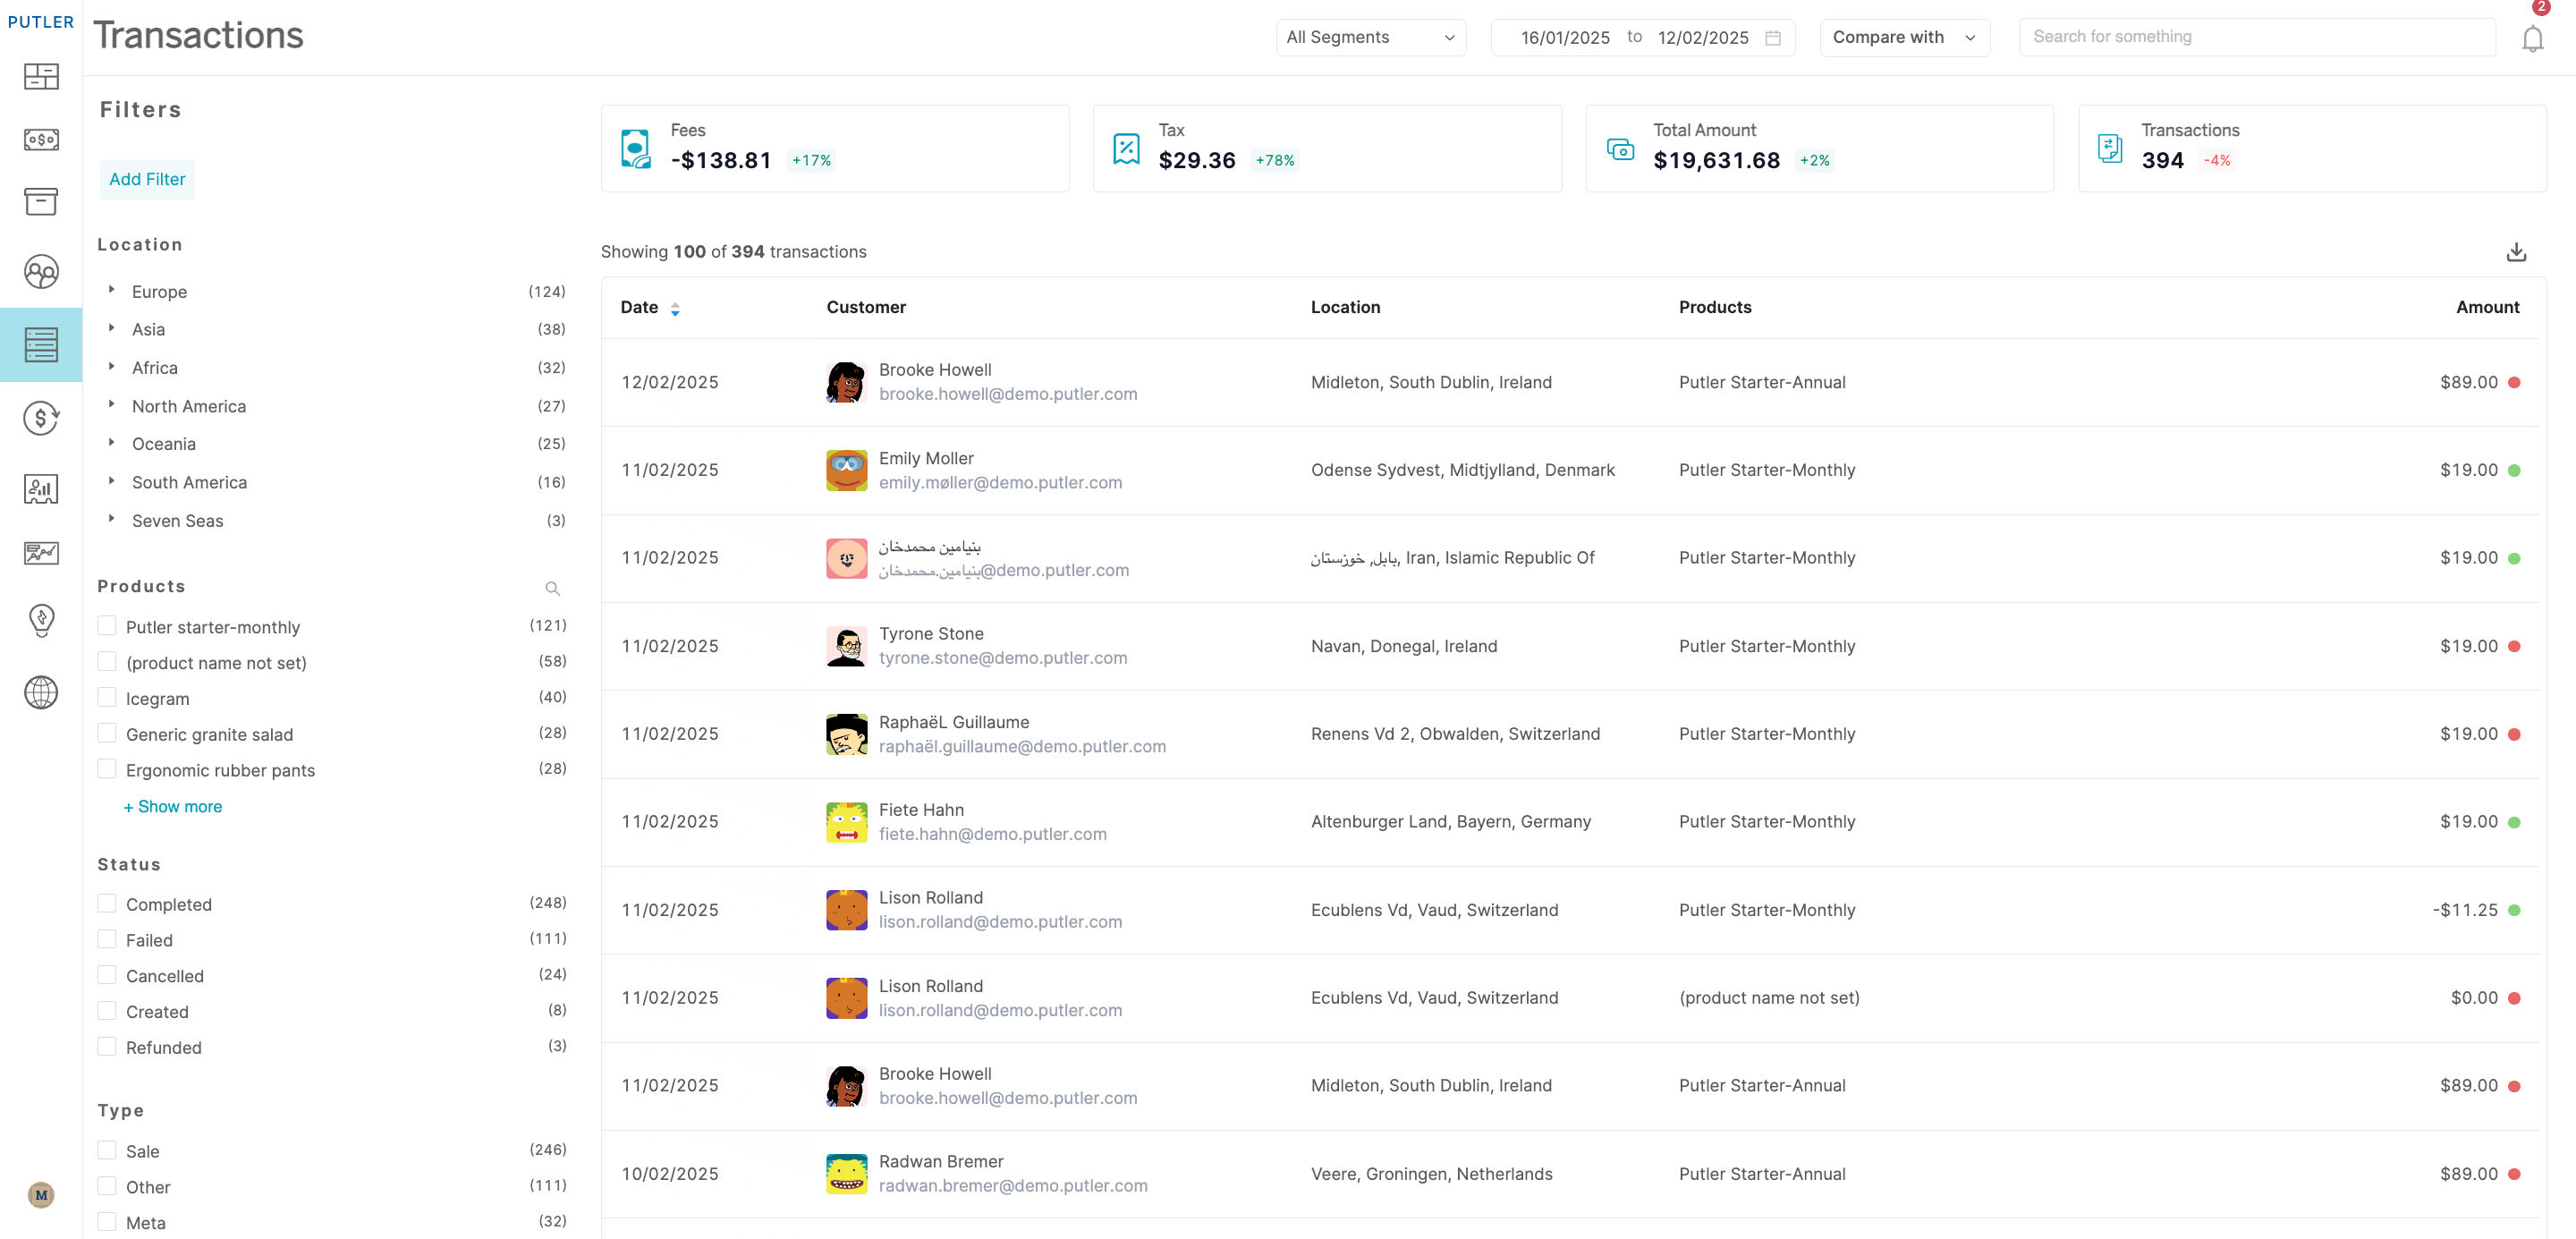
Using these reports, you can understand which store is performing well. You could offer discounts in those stores on your Razorpay payment gateway and encourage more users to use the platform.
For businesses also processing payments through PayPal, Putler handles multiple PayPal accounts alongside your Razorpay data — eliminating the need to manually consolidate reports from different gateways.
Multi-currency setup
Businesses today operate beyond national boundaries and, therefore, need a system with multiple time zones and currencies. Putler is one of the top tools when it comes to multi-currency accounting.
Currently, our platform provides you with 36 currencies (and rising) from which you can choose.
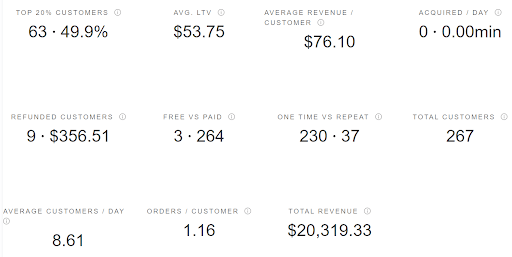
In-depth insights
Razorpay reports are limited to transaction amounts, but you can view a lot more in Putler’s ecosystem. Our platform generates data such as how much your top 20% of customers contributed to your monthly sales. Alongside, there are essential SaaS metrics like Lifetime Value (LTV), Average Revenue per Customer, One Time vs. Repeat, and more.
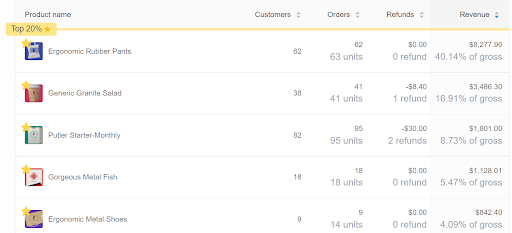
But it’s not just customers. You can also view detailed particulars on products. Again, you can check which products made it to the top 20% and how much they contributed to sales. Additionally, you’ll see your gross revenue, the fastest or slowest moving product, and your top 5 products overall. You could use this information to modify your product strategy – for instance, bundling products with these popular ones to move inventory.
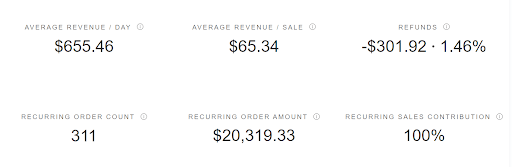
There’s more. Ever wondered what more insights you could get on overall orders? Putler’s done that for you. Putler calculates your Average Revenue per Sale and Day, along with ‘recurring order count’ and ‘recurring order amount.’ Also, you can view separate insights for completed and refunded orders. Using this information, you’ll get an idea of the least amount of sales you make and plan to move up from there.
Unique analyses
One of Putler’s unique features is the daily Did You Know (DYK) updates. Each day, you get a different insight based on your recent activity. This analysis will help you make product or marketing decisions for further exploration.
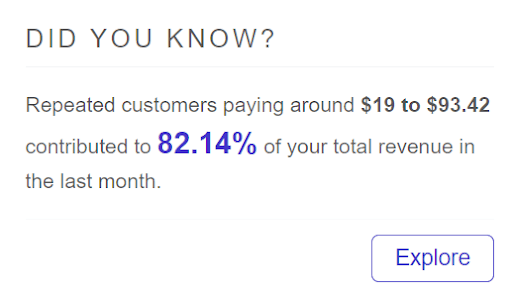
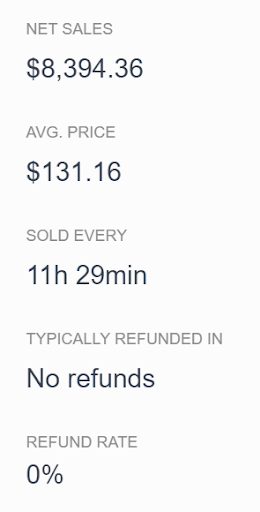
As you go deeper into Product sales particulars, you can view data specific to certain products, such as the number of orders, refunds, and customers who bought them. There’s one more key insight for you. You’ll also get to see which other products customers purchased along with the current one. This is helpful when planning bundles (as we mentioned in the previous section) because you know which products you can pair together for higher order amounts.
You can also view the average price your stores sold a given product for in the same section. It helps you set a suitable price range that maximizes revenue.
Customized observations
Razorpay analytics doesn’t allow you to customize and extract data for comparative analysis. On the other hand, Putler lets you create customized segments, pulling out specific details and comparing the information.
For instance, if you want to determine which location gives you the highest sales for a particular product, you can create a custom segment and save it for future use. Another example could be finding out which location has sales in a given range, and you can create another custom segment for this. There’s no upper limit on the number of customized segments you use.
Customer segmentation
Another unique feature available only in Putler is the Recency, Frequency, and Monetary (RFM) analysis. It segments customers into categories from loyal to lost, depending on their engagement with your brand.
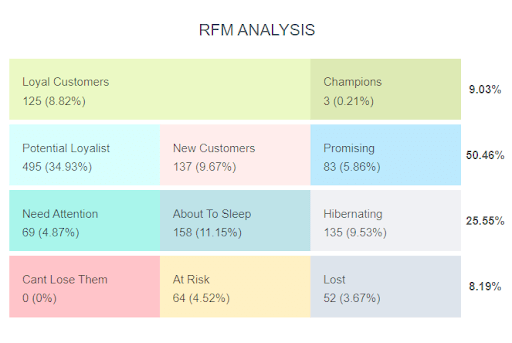
On clicking on each section, you’ll find overall and individual customer and order information. Using the RFM analysis, you can develop strategies for each category. For example, ‘loyal’ customers can be invited to your loyalty program. Or you can send ‘at risk’ ones special discounts to encourage purchase.
Now that you’ve seen the powerful insights Putler shares with you, check out all its features and get in touch with our team to learn more!
Whether you’re using Razorpay, Stripe reporting, or multiple gateways simultaneously, Putler normalizes all your payment data into a single, coherent analytics dashboard.
The bottom line
Razorpay payment gateway is a comprehensive payment gateway for your business. But that’s where the insights stop, and you need to use different tools to extract custom analyses for your needs.
Putler saves you time and effort by providing unique insights and data from multiple stores in one place. If growth is your goal, we will make it achievable for you!
- Google Analytics eCommerce: All the e-Commerce Tracking Problems & How to Fix Them
- Shopify Google Analytics: Step-by-step Guide
- eCommerce Analytics 101: Get Answers To All Your Questions Related to Tracking your eCommerce Business
- Multichannel Analytics: The Holy Grail For Store Owners Having Multiple Stores
- WooCommerce Analytics: Complete Guide To Successful WooCommerce Reporting
- Subscription Analytics Tools: The Details You Need to Know