Managing an eBay store as a small business owner can be overwhelming. Exporting data, managing spreadsheets, and identifying growth opportunities can take away hours—time that could be spent expanding your business.
But what if you could do all this in just a few clicks?
With the right analytics tools, you can access in-depth insights in minutes, cut down hours of routine work, and instead spend time growing sales.
This guide covers eBay’s built-in analytics, their limitations, and the best third-party tools to help you make smarter decisions and grow your sales. For a complete deep-dive into eBay analytics, check out our comprehensive guide on eBay analytics.
What is eBay analytics?
eBay Analytics—also known as Listing Analytics—is a set of reporting tools designed to help sellers track how their listings are performing. These reports provide valuable data on key metrics such as impressions, click-through rate (CTR), ranking, and more.
With these insights, you can:
- Understand which listings attract attention (and which don’t)
- Spot patterns in buyer behavior
- Make smarter decisions to improve your listings and boost sales
In short, eBay gives you several built-in reports to help track different parts of your store’s performance. Let’s break down each one—and what kind of insights you’ll get from them.
Types of built-in eBay reports (and what they tell you)
eBay has different types of reports serving specific purposes. Let’s take a look below:
Sales report
The eBay Sales Report helps eBay sellers keep track of how well their listings are doing—from sales volume and pricing to shipping and fees. It’s a great way to measure performance and spot areas for improvement.
Sales reports include –
- Date of sale – When the transaction took place
- Sales record – Total number of sales completed
- Quantity sold – Number of items sold
- Gross sales – Total of item price + shipping + handling
- Item cost – What you paid for the item
- Customer shipping charges – What the buyer paid
- Your shipping cost – What you paid to ship
- eBay fees – Commission eBay takes from the sale
- Payment gateway fees – Charges from PayPal or others
- Sales tax – Tax applied to the item
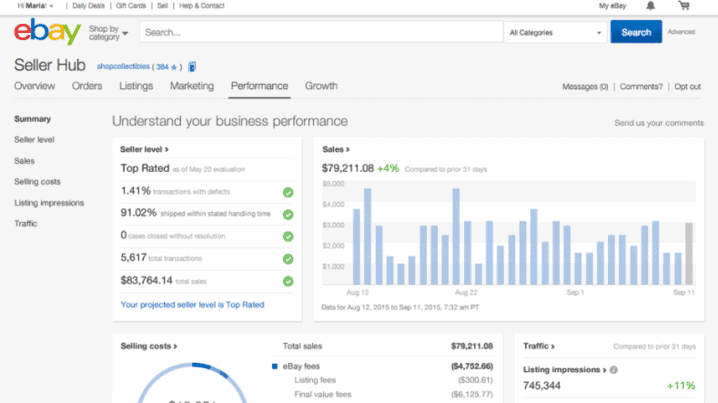
Seller performance report
eBay doesn’t just track buyers—it also keeps tabs on how sellers are doing. That’s where the Seller Performance Report comes in. It measures how well you serve customers and assigns a performance level based on your service.
Here are the seller levels:
- Top-rated sellers are the best, providing exceptional customer service and meeting minimum sales requirements to enter the category.
- Above-standard sellers meet some or all of the minimum customer service requirements.
- Below-standard sellers don’t meet one or more minimum customer service requirements.
Some of the metrics tracked are Transaction Defect Rate, Late Shipment Rate, and Cases closed without Resolution.
Traffic Report
Think of the Traffic Report as your store’s marketing dashboard. It shows how shoppers find your listings, how many views each product gets, and which keywords or search engines drive traffic.
Here’s what you’ll find in the traffic report:
- Unique visitors for a given day or month
- Page views for each page
- Popular listings with the highest views
- Search engines that people use to reach your store or listings
- Search keywords that people used to find your store or listings
While eBay’s native reports are helpful for basic tracking, they do have some important limitations—especially if you’re trying to grow your store strategically.
Why eBay’s built-in reports aren’t enough for growth?
While eBay’s built-in analytics offer a solid starting point, they fall short when it comes to growing and scaling your business. The reports give you surface-level data—but if you want to make strategic decisions, track long-term trends, or deeply understand your customers, you’ll quickly hit a wall.
Here are some key limitations of eBay’s built-in reports:
- In-depth product insights are missing.
- It lacks integration with other eCommerce activities for a holistic business understanding.
- Customer insights are also not present on eBay’s analytics dashboard.
- Downloading multiple reports from different places can get time-consuming (up to 60 minutes!) and confusing.
- eBay only allows access to the past 90 days of data. If you want to run analysis beyond that, it isn’t available within eBay.
eBay’s free research tools: Product research and sourcing insights
Before investing in third-party tools, make sure you are using eBay’s free research features. In May 2024, eBay rebranded Terapeak and made it more accessible to all sellers.
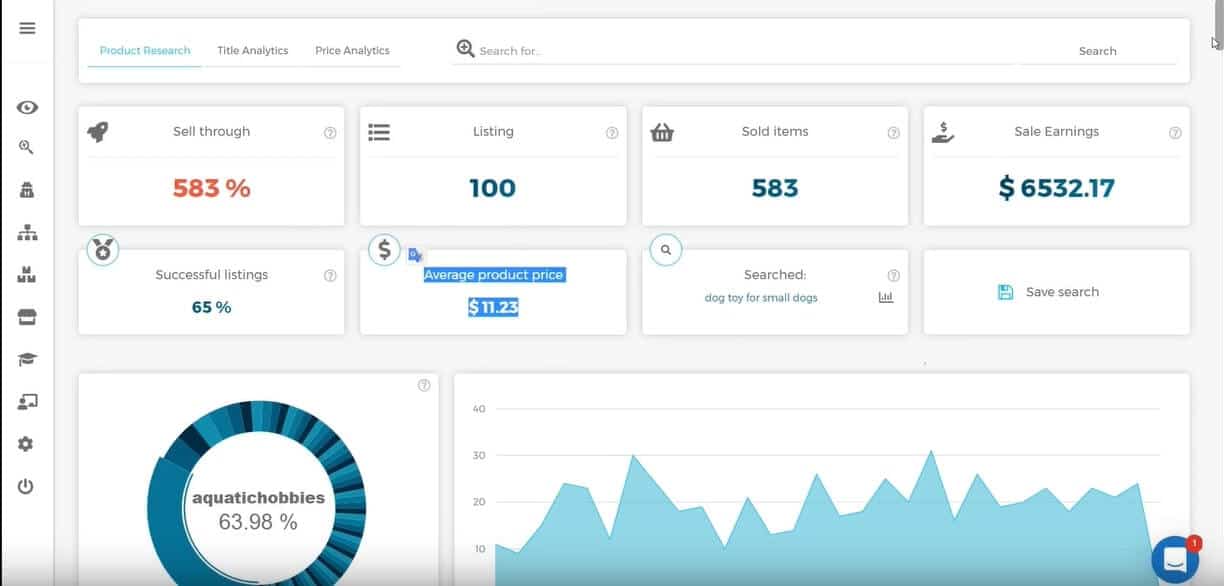
Product Research (formerly Terapeak Product Research)
Product Research is now free for all eBay sellers with Seller Hub access. It provides three years of historical sales data to help you decide what to sell, when to sell, and how to price your items.
Key features:
- Search by keyword, product ID, or category
- View actual sold prices (including Best Offer accepted prices)
- See the average sold price and price ranges
- Check the percentage of sellers offering free shipping
- Identify seasonal trends and demand patterns
- Access data on mobile through the eBay app
How to access:
- Log in to Seller Hub
- Click the “Research” tab
- Select “Product Research”
Sourcing Insights (formerly Terapeak Sourcing Insights)
Sourcing Insights helps you identify categories with high demand and low inventory. This is particularly useful for finding products to add to your store.
Key features:
- Analyze category-level supply and demand
- Spot underserved niches with growth potential
- Develop sourcing strategies based on real sales data
- Compare your inventory against market opportunities
Availability:
- Free for Basic, Premium, Anchor, and Enterprise Store subscribers
- $12/month for Starter Store subscribers
- $19/month for non-Store sellers
Mobile access
As of 2024, Product Research is available on the eBay mobile app for iOS and Android. You can research products while sourcing at thrift stores, estate sales, or anywhere you find potential inventory.
Better eBay analytics with third-party tools
While eBay’s built-in reports are a good starting point, they’re often not enough to fuel real growth. That’s where third-party tools come in—they give you deeper insights, help you make smarter decisions, and even save you time.
Here are three powerful eBay analytics tools worth checking out:
Zik Analytics
Zik Analytics is a market research tool tailored for eBay sellers. It helps you uncover what’s trending, spy on competitors, and source high-demand products—all in just a few clicks.
Price: Starts at $16.65/month
Pros
- Simple and beginner-friendly interface
- Helps you understand market trends quickly
- Saves time with efficient product research
Cons
- Customer support can be slow
- Occasional software lags
- Some users report billing issues
AlgoPix
AlgoPix focuses on product and market intelligence. It helps you decide what to sell, where to sell, and at what price. You can also analyze demand and competition to fine-tune your strategy.
Price: Starts at $29/month
Pros
- Supports analysis across multiple sales channels
- Offers Google Ads-based marketing insights
Cons
- No access to historical data
- Limited category-specific analytics
- May experience occasional lags
Putler
Putler isn’t just another analytics tool—it’s a comprehensive eCommerce growth platform. Whether you’re running one store or several, Putler helps you monitor sales, understand customer behavior, and grow with confidence.
Price:
- Starter plan – $20/month
- Growth plan – starts at $50/month
Pros
- Deep product insights and KPIs
- RFM analysis & customer segmentation
- Create custom segments and make data-driven decisions
- Combine multiple eBay stores in one dashboard
- Historical data access (beyond 90 days)
Cons
- No inventory tracking
- No dedicated mobile app
- Listing analytics not included
Why Putler is the best choice for eBay analytics?
We know—every tool claims to be the best. But when it comes to actionable insights, ease of use, and real growth potential, Putler truly delivers.
Unlike eBay’s built-in analytics or other third-party tools, Putler doesn’t just show you the numbers—it helps you understand them. From revenue breakdowns and top-performing products to customer behavior and multi-store insights, Putler gives you a complete picture of your business in one intuitive dashboard.
Here’s how Putler stands apart:
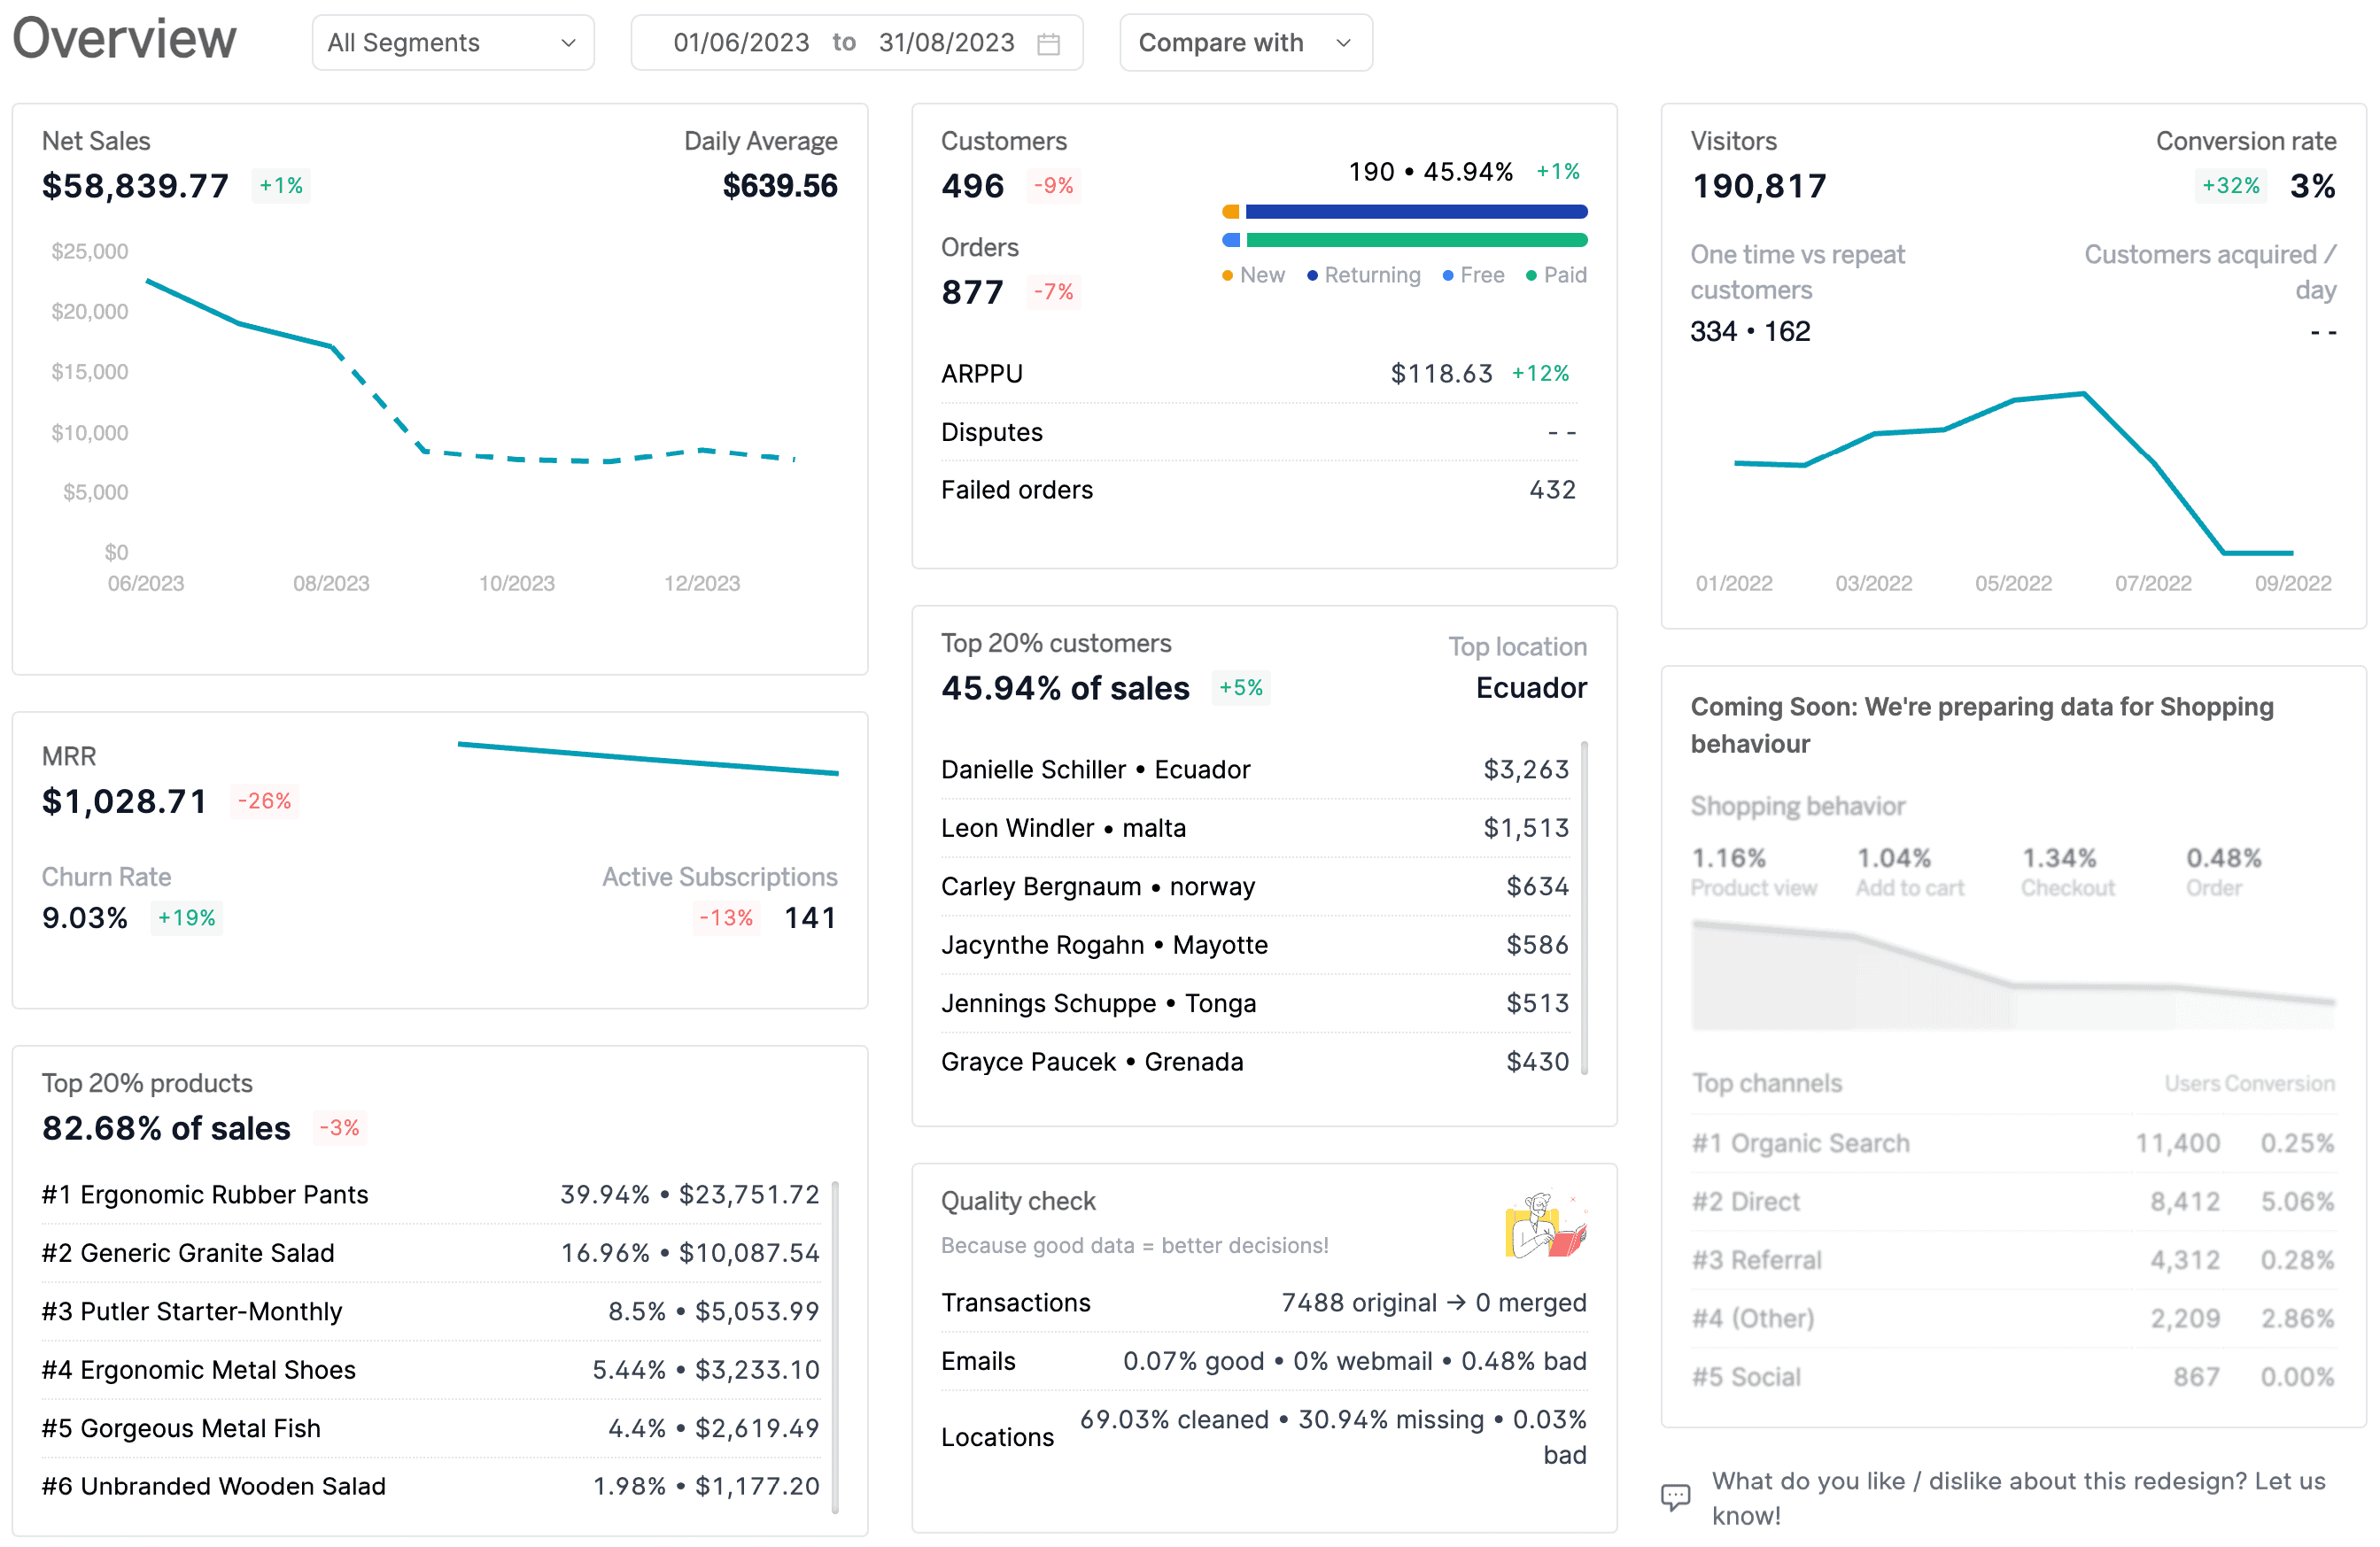
Detailed reports
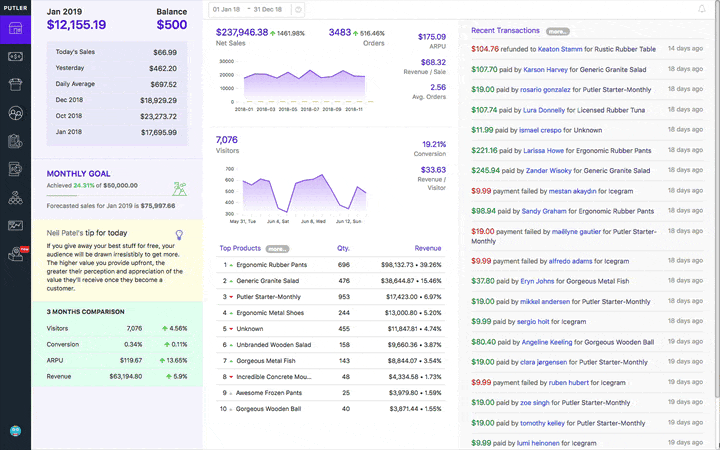
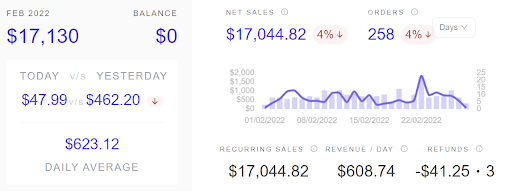
Putler’s analytics are robust and comprehensive, combining data from multiple eCommerce platforms (and multiple eBay shops) in one place. It captures revenue, sales, products, and customer analytics through various metrics like recurring sales, revenue per day, daily average sales, and more.
Access to historical data
Most eBay analytics tools provide only real-time information. With Putler, you’ll also get access to historical data, which lets you analyze changes over time. eBay itself has a 90-day data restriction. But Putler solves that problem by storing historical data for future use.
This historical data can go back years, so that you can check monthly and yearly performances, and make more accurate data-driven decisions. And it doesn’t just include sales. You can also view historical customer data for better customer support, product trends, and a lot more.
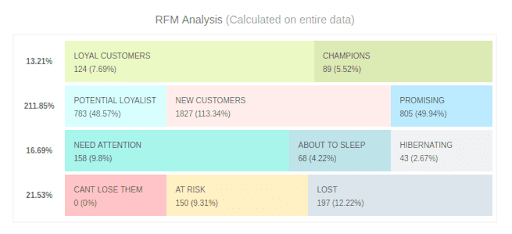
Extensive segmentation and drilldowns
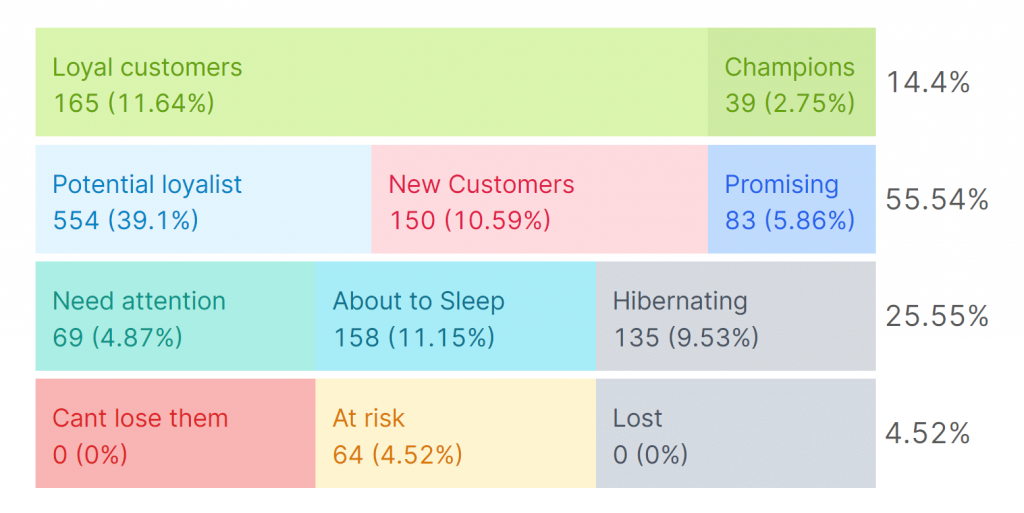
You can create custom segments for products, selling locations, sales, revenue, price points, and more. Putler also provides a ready-to-use customer segmentation technique called RFM segmentation. This method segments customers based on their shopping behavior.
There’s no upper limit on the number and type of segments, which gives you the freedom to choose what reports best serve your needs.
Intuitive insights
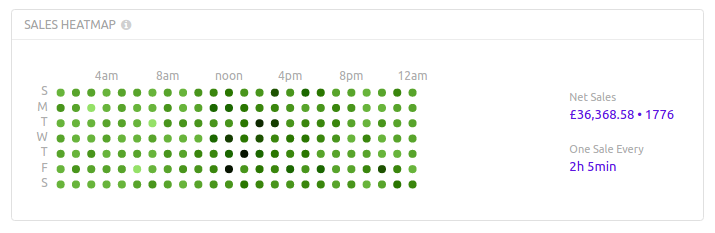
With so much information at your fingertips, it could get overwhelming to figure out how to use the data. But Putler solves that for you, too. The tool provides useful insights such as sales heatmap, products that are frequently bought together, product variation popularity, refund rate, sale velocity, daily data insight, order tracking, refunds and returns, average order value, recurring vs. one-time sales, and more.
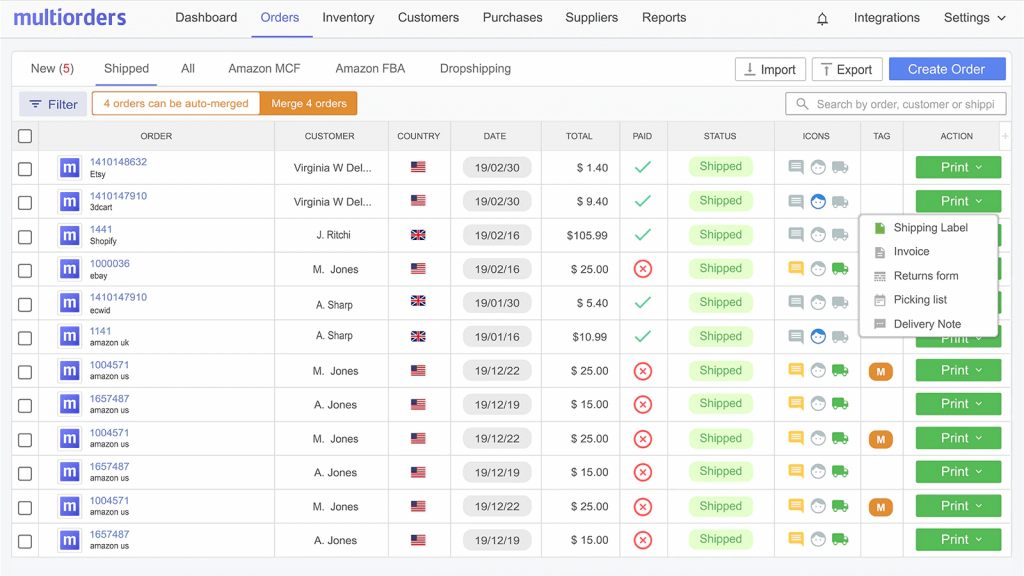
Managing eBay orders efficiently becomes critical as your store grows. Centralized order tracking eliminates the need to switch between platforms and reduces fulfillment errors.
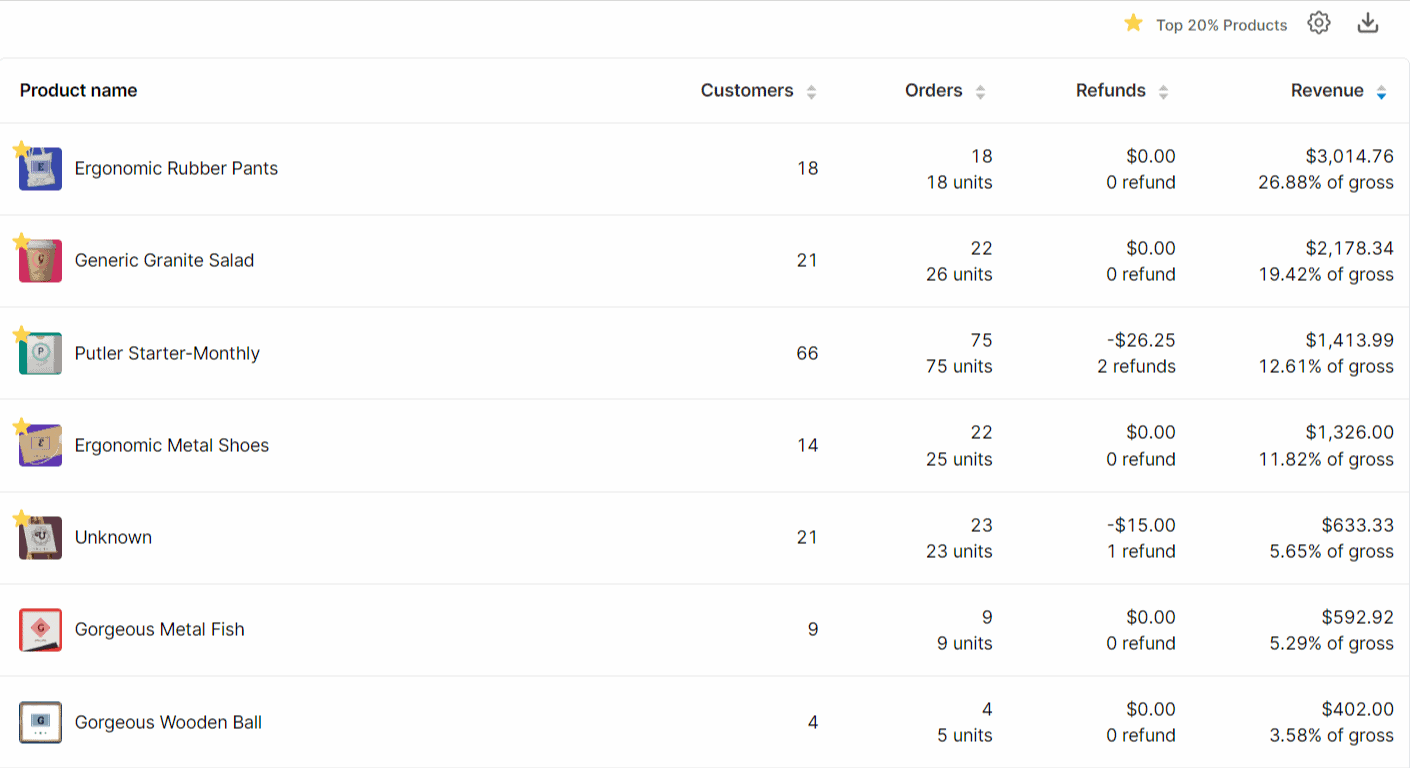
Product reports
Knowing your top-selling products is great—but understanding why they perform well lets you take strategic action to boost sales. With product management, you’ll find out
- Which product is trending?
- Which products sell the most?
- Which product is losing popularity?
- Which product variation sells the most?
- Which products do customers purchase together frequently?
- What are the average product price buckets?
- How much of your gross revenue includes refunds or returns?
- Why was a product returned?
Customer insights
Finding data on customers is a significant pain point for sellers. What makes Putler stand out is its in-depth analysis of your customers. It lists essential metrics such as Lifetime Value (LTV), Churn Rate, and Recurring Sales.
You can also view information regarding specific customers, including demographics, customer support history, website screenshots, subscriptions, refunds or returns, and geolocation. Still, want more? Then check our RFM analysis, which other eBay analytics tools and eBay itself don’t provide.
Google Analytics integration
Putler lets you integrate your Google Analytics data into the platform, giving you a holistic understanding of your overall store performance. You can easily view search-related information for your listings.
Managing multiple stores
Have multiple eBay stores, or are you planning to scale? You can manage them seamlessly from one place. From monitoring all of them on one dashboard to viewing individual reports for each, we’ve got you covered. You can also compare performances between stores and find insights for taking further action.
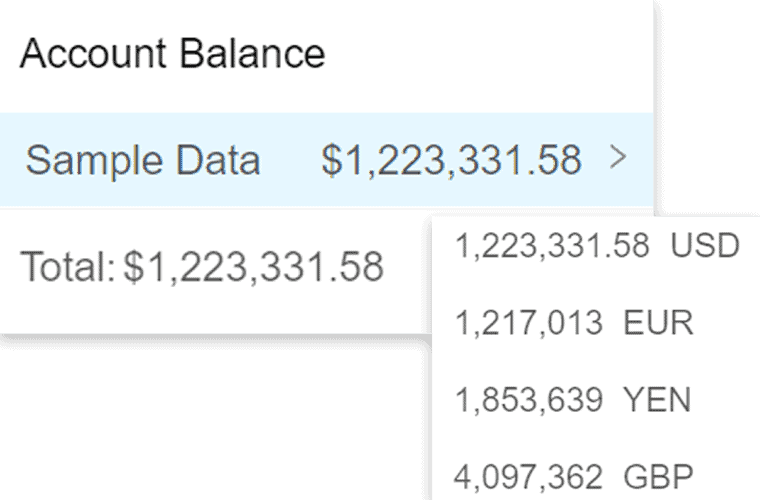
Multichannel, multi-currency, and multi-team support
Putler doesn’t just serve eBay stores. You can consolidate multiple stores functioning through various channels.
And when it comes to international payments, our tool supports several currencies. Putler will automatically take care of currency exchange and time zone changes, and provide you with reports in your base currency at all times.
Plus, your store will have support using features for multiple team set-ups within one dashboard.
Final thoughts
eBay’s native analytics offer a decent starting point, but real business growth needs more than just the basics. To boost sales, stay competitive, and work smarter—not harder—you need deeper insights, long-term trends, and actionable reports.
Third-party tools like Zik and AlgoPix help with market and product research—but if you’re looking for an all-in-one solution that connects the dots across products, customers, and performance, Putler is the clear winner.
Whether you’re managing a single eBay shop or juggling multiple stores, Putler gives you the clarity, control, and confidence to scale.
- Multiple eBay accounts: The only guide you need
- [Ultimate Hack] How to export over 90 days of eBay data?
- Etsy vs eBay: A Deep Dive Into The Best eCommerce Marketplace
- 8 Best eBay Tools for Sellers in 2025