It’s not hard to believe how far Amazon has come from its early days. From selling books online to now selling everything and anything on its most sought-after website, the e-commerce mogul now dominates 40% of the market share in the U.S.
Thanks to the era of digitalization, Amazon has kept upgrading itself to the point of uber sophistication. Sellers can now operate the website as their own eCommerce platform thanks to Amazon’s well-rounded services.
However, it would take time for a beginner to learn to operate the nuts and bolts of these services. One way to do it is through reliable analytics, which Amazon is pretty good at.
That being said, if you are aspiring to have your own eCommerce store on Amazon but don’t know how to leverage it to your advantage, then this blog is for you.
What is Amazon Analytics?
Let’s start with the basics. What the heck is Amazon analytics?
Just like any other eCommerce platform, Amazon too has a set of services that reads, aggregates and converts data of customer activity into valuable reports for the benefit of the seller. In simple terms, it tells you what is happening in your store, just like a real manager.
This data helps sellers gain valuable insights into their store’s online performance by showcasing customer behavior, popular keywords, and even competitors’ activities. Having access to this kind of factual data is critical since you can use it to make well-informed decisions about sales, advertising, and promotions, and grow your business exponentially.
However, you need to keep in mind that, Amazon provides analytical reports only to the members of Amazon Brand Registry.
Why is Amazon Analytics important?
Amazon analytics is not just some bunch of numbers. It is a powerful tool that guides you to success.
Most sellers don’t realize the power of facts and figures as they are solely focused on increasing sales. But that’s where you are missing the big picture.
Given the cut-throat competition online, it’s imperative for a seller to know their business in and out, plan their strategy and reach out to their customers in the right way in order to thrive.
This competitive edge can be achieved through the help of insights on customers and their shopping behavior along with more consolidated data on payments, sales, returns, orders, settlements and more. Combining this power with digital marketing can help you become a top seller on Amazon.
Yes, Amazon analytics tools not only helps a seller plan out their next move but also empowers them to run a business with informed facts backed by data.
Types of Amazon Reports
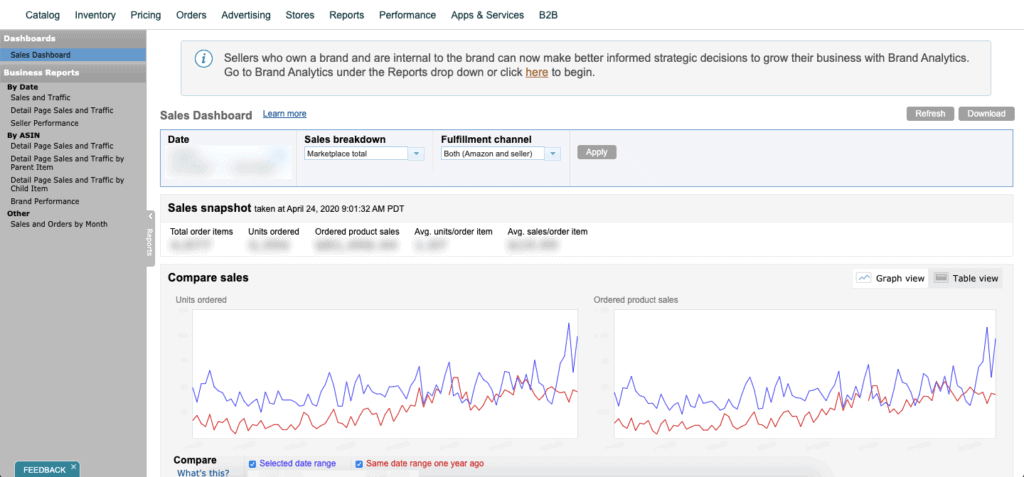
There are various types of reports that one can find on Seller Central as well as through Fulfilled By Amazon. Here is a brief look at some of the important Amazon reports offered by both.
| Report | Description |
|---|---|
| Inventory Report | Details the 360 of your inventory including a summary of your product listing and their quantity. |
| Payment Reports | This report lists all your transactions and payments in a single place including storage charges, settlements, reimbursements, fees etc. |
| Business Reports | As the name suggests, this report will give you a complete overview of your business like performance, suppliers, stock, incentives etc. |
| Sales Reports | Will provide you with an understanding of your daily, monthly, and yearly sales of your orders, shipment etc. |
| Return Reports | This report will give you an overview of pending and completed return requests from your customers by dates. |
| Order Reports | The report details the number of orders placed, canceled and shipped along with individual order’s summary. |
| Product Reports | N/A |
| Customer Reports | N/A |
| Custom Reports | Custom Reporting Platform enables a seller to export any business report into CSV format. |
| Amazon Search Terms Report | The report shows the most popular terms searched on Amazon by users. Helps sellers understand how customers find their products. |
| Item Comparison Report | Shows the top 5 products that customers viewed frequently alongside competitor products. |
How Amazon Analytics can positively impact your business?
Amazon Business Analytics provides valuable insights into your organization’s spending habits. And, using these analytics, you can optimize your purchasing decisions and identify opportunities to improve your business. Here are some of the benefits of using Amazon Business Analytics:
- Improved visibility into spend: With Amazon Business Analytics, you can see exactly where your organization’s money is going and identify areas where you may be overspending.
- Optimized spend: By analyzing spending patterns, Amazon Business Analytics helps you optimize your organization’s spend and save money in the long run.
- Access to multiple reports: Amazon Business Analytics provides access to a variety of reports, giving you a comprehensive view of your organization’s spending habits.
- Save time: Automating the data collection process with Amazon Business Analytics saves you time that you can use to focus on other important tasks.
- Gain insight: By providing valuable insights into spending patterns, Amazon Business Analytics helps you identify opportunities for improvement and grow your business.
- Meet your goals: With Amazon Business Analytics, you can set goals and track progress towards achieving them. This helps you stay focused and make data-driven decisions to reach your desired outcomes.
These make it quite clear that Amazon Business analytics is indeed a very powerful tool. However, like every other tool, there are some potential problems that sellers may encounter.
Problems with Amazon Reporting
As we mentioned earlier, Amazon analytics is a great way to gain insights, but in today’s competitive world, it’s simply not enough. Think about it, you get the same type of information that thousands of other sellers have access to, being members of Amazon Brand Registry.
Plus, there are a few things that Amazon analytics fails to provide like :
- Multi-store reporting- You only get reports on individual accounts so keeping a track of your stores could get tough
- Segmentation and bifurcation- you will have to visit multiple sections for data on multiple features, this can get confusing on so many levels
- No insights- All you get is point blank numbers. You need to analyze and decipher the data on your own.
- Basic customer data- You only get basic data on your audience so understanding them becomes difficult.
- Export- Amazon reports aren’t readily available to export, you need to request the report from Amazon to get it.
So where’s the competitive edge?
To stand out and make a difference with your data, you need a tool or an extension that would convert all your Amazon data into actionable insights.
Top Metrics to track in Amazon Analytics
Having a tool that can help you make the most of your data will be of no use if you don’t know what metrics are the most crucial for your business.
So, what metrics should you be tracking in Amazon Analytics? Here are some of the top ones to keep an eye on:
- Advertising Cost of Sales (ACoS): This metric shows you how much you are spending on advertising relative to your revenue. By keeping your ACoS under control, you can make sure your ad spend is actually driving sales – not just burning a hole in your wallet.
- Average Order Value (AOV): AOV gives you a sense of how much your customers are spending per order. By boosting your AOV, you can drive more revenue without necessarily increasing your customer base.
- Break-even ACoS: This metric tells you the ACoS you need to break even on your advertising spend. By keeping your ACoS below this threshold, you can be sure you’re making a profit on your ads.
- Click-through rate (CTR): CTR measures how often people click on your ads. It’s a great indicator of how well your ads are resonating with your target audience. By monitoring your CTR, you can see if there are any opportunities to improve your ad copy and increase engagement.
- Conversions: This metric tells you how many people are taking a desired action on your listings, such as making a purchase or signing up for a newsletter. By optimizing your listings and improving your product information, you can increase your conversion rate and drive more sales.
By tracking these metrics, you can make data-driven decisions to optimize your advertising campaigns, increase sales, and improve profitability.
And, as we mentioned earlier, with the right tool, you can easily collect and analyze this data, and turn it into actionable insights to help your business grow.
Third-party Reporting Tools for Amazon Reporting
There are a number of Amazon analytics tools that can assist you in getting more detailed reporting like AMZ Tracker, SellerBoard, DataHawk, Priceblink etc.
Here’s a separate blog to help you with that.
But wait. Putler has it all… and more
What can you get in Putler that you can’t get in Amazon Analytics? Marketing insights. Putler is not just your average data aggregating software, it’s your business partner in crime. Here’s why you should rely on it.
Data Aggregation
With Putler, you can aggregate all your Amazon data into a single dashboard in the form of presentable pictorial charts, graphs, insights and more. You can keep a track of single as well as multiple stores, and multiple payment gateways along with auto currency exchange based on various time zones and payment accounts.
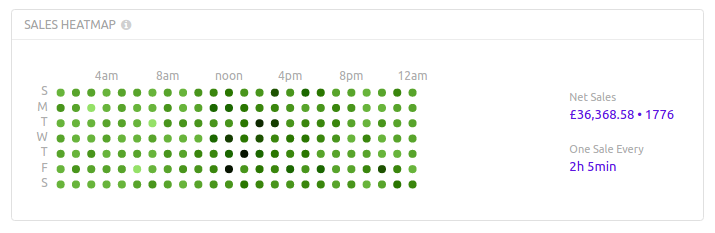
You can view aggregated data to understand business performance as well as dig into individual data to see customer behavior. What’s more? Putler intuitively reads the data and shows you the gaps and opportunities in the form of a Sales Heat Map.
Detailed Reports
Reports help you understand your performance, hence we have equipped Putler with the ability to aggregate data into standalone reports to help you understand the various aspects of your business like Sales, Orders, Products, Customers, Audience Activity, Subscriptions, Payments, Transactions, and more. From best performing products to insights into your customers’ interest – Putler covers it all.
Interesting Insights
What happens when data becomes smart? More sales!
A key feature that Putler provides is insights into your gaps and opportunities. For example, you can find frequently bought together products and maybe create a combo offer on them to boost sales.
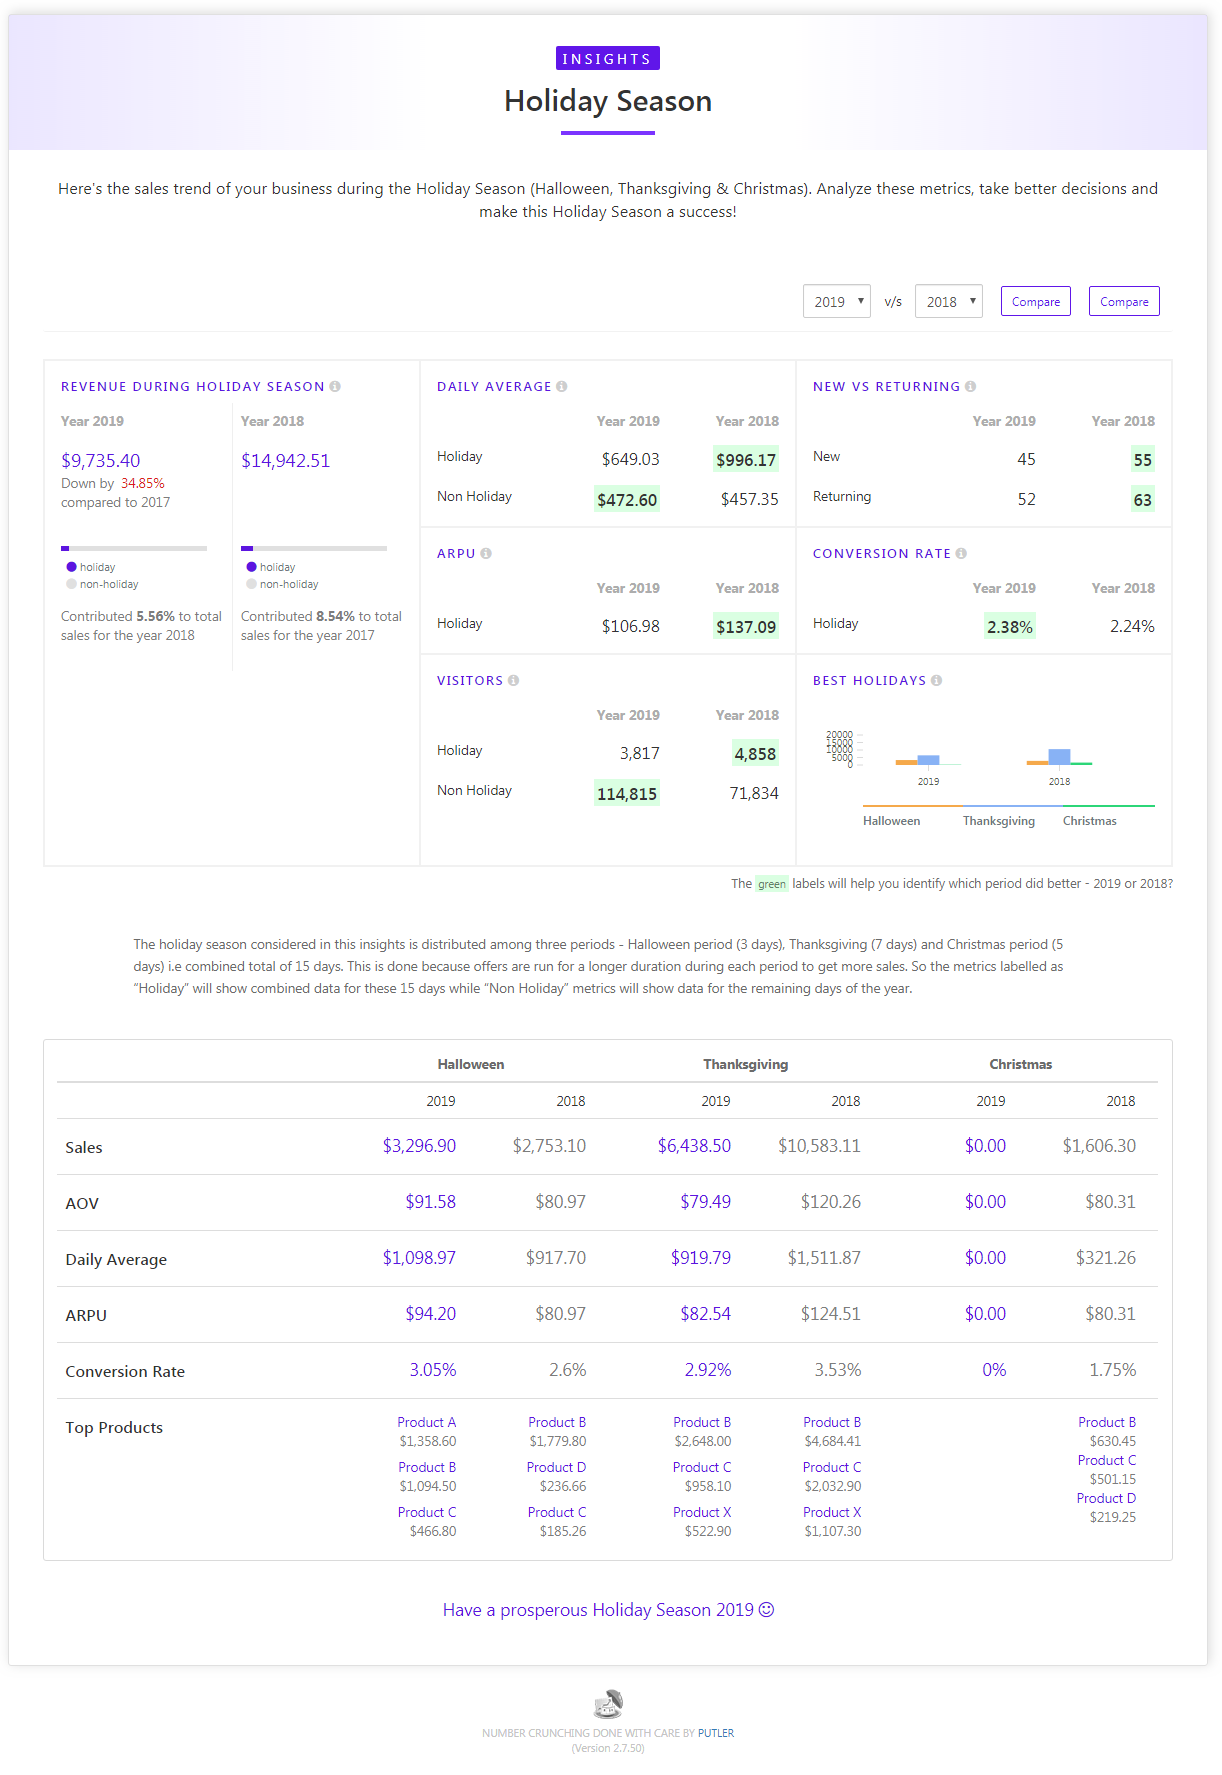
Furthermore, you can view your revenue during holiday seasons and see which products have been popular so you can remarket them during the next occasion. Putler also has the ability to read your current sales trends and forecast what your next monthly revenue will be like to keep you motivated in reaching your goals. Along with this, pricing insights will help you to see the best price range that attracts customers to your store, so you can price your products accordingly.
These features aren’t available on Amazon. Never make a marketing mistake with these smart insights.
Customization
Want to view a specific set of data within vast data? Putler’s customization feature is here for you.
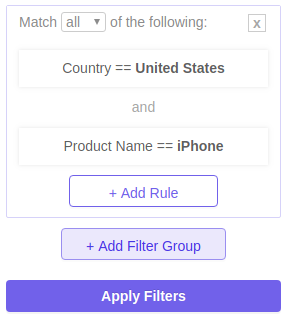
With Putler, you can create segments and bifurcate data as you see fit by using readily available filters or you can make custom filters of your own.
For example, if you want to go back to the past and compare your performance of a certain time period then you can use the compare feature to do so. Moreover, you can filter aggregated data for a certain time period, specific day, date range, or a specific customer.
The sky’s the limit.
Customer Segmentation
The art of sales depends on how well you know your audience.
You need to know who they are, where they are from and what they do, their likes, dislikes and interests.
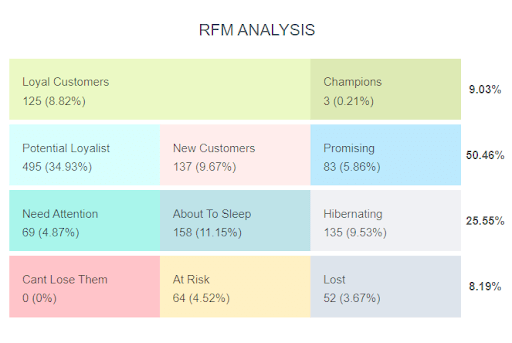
Amazon data analytics’ limited ability doesn’t give you the information you need to thrive your sales, that’s why we have equipped Putler with customer segmentation feature based on recency, frequency and monetary value amongst other filters.
There’s more
Along with the above, you also get access to:
- Saas metrics like ARR, MRR, customer lifetime value, churn rate
- Multi store reporting
- Easy to understand user interface
- Email alerts about weekly performance
- Ready-to-use filters and quick search
- Unlimited export to CSV files
Still not convinced? Here’s a helpful demo for you.
Final thoughts
Amazon + Analytics is the key to eCommerce success. With the right set of tools you can boost sales and become a brand name for yourself.
If you ever need any assistance, just drop us a message! You can also join our community and keep up with the latest updates on Twitter.
Don’t forget to check out Putler before you go. Good luck!
FAQs
What are Amazon Seller Analytics Tools?
Today, we have software and tools for everything because they simplify the process and provide accurate results. It’s beneficial to sell on Amazon, no matter how big or small your business is, no matter how old or new you are.
The challenge is managing everything seamlessly, especially for big sellers and sometimes even for novices. In this case, Amazon seller analytics tools are useful.
Why do we need Analytical Tools?
With Amazon Analytics, you can determine how your business is doing now, as well as how it will perform in the future (or decline).
What is the best Analytics Tool for Amazon Sellers?
There are many analytics tools available on the market. Here are the tools we recommend for sales and profit analytics.
- Best Amazon Analytics Tools
- Marketing Analytics: Everything you need to know!