

Stripe is excellent at payment processing. Where it gets thinner is business analytics: understanding who is buying, why they churn, and how to sell more. Stripe payment analytics covers payment performance well, but for eCommerce sellers who need customer, product, and revenue insight, the reporting stops short.
This guide explains what Stripe payment analytics does, where it’s genuinely strong in 2026, where it falls short for eCommerce businesses, and how to fill the gaps. It covers the metrics that matter, the native Stripe reports worth using, and the workarounds sellers reach for when Stripe’s numbers aren’t enough.
What is Stripe payment analytics?
Stripe payment analytics is the set of reports inside the Stripe Dashboard that track how your payments perform. It answers questions about whether payments succeed, why they fail, how fraud and disputes trend, and how authentication affects your success rate.
The core reports Stripe provides include:
- Acceptance analytics: Payment success rate and network authorization rate, with the ability to see where and why payments fail.
- Authentication analytics: How 3D Secure affects your success rate, useful for businesses under Strong Customer Authentication rules in Europe and the UK.
- Dispute analytics: Dispute volume, rates, and outcomes over time.
- Billing analytics: MRR, churned revenue, and subscription growth for businesses using Stripe Billing.
These reports are built around one question: how healthy is the payment flow? That’s a real and useful lens. It’s just not the same question an eCommerce seller asks when they want to grow revenue.
What Stripe’s native analytics does well in 2026
Stripe has invested heavily in analytics, and it’s worth being honest about what the native tools now handle. Dismissing Stripe entirely would be inaccurate.
Stripe’s payment-performance reporting is genuinely strong. Acceptance analytics can pinpoint where in the flow payments drop, authentication analytics show the impact of 3D Secure, and dispute reporting tracks chargeback trends clearly. For a finance or payments team focused on optimizing the checkout and reducing failed payments, these are solid tools.
At Stripe Sessions 2026, Stripe also launched a Dashboard assistant for payments analytics. It investigates performance issues, diagnoses root causes, and recommends next steps in natural language. That’s a meaningful step up for teams debugging payment success rates.
Here’s the honest boundary: Stripe’s analytics are built for payment performance, not for business intelligence. They tell you how money moves through the checkout. They don’t tell you which customers are worth the most, which products drive repeat purchases, or how a cohort from March is retaining six months later.
Where Stripe payment analytics falls short for eCommerce
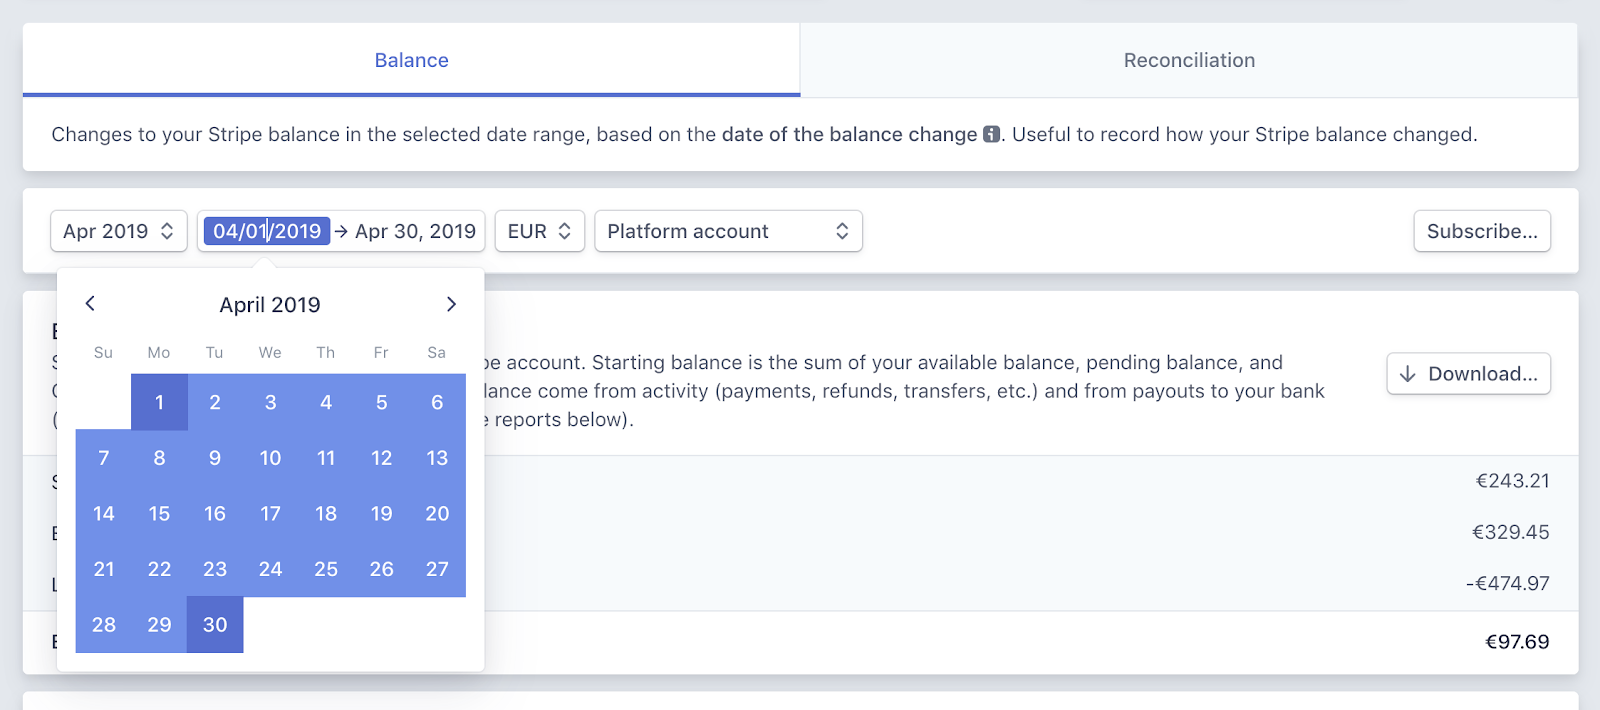
For eCommerce and subscription businesses, Stripe’s reporting leaves real gaps. These are the insights sellers most often go looking for and can’t find:
- Revenue forecasting: Stripe shows Monthly Recurring Revenue but lacks tools to forecast future revenue.
- Detailed subscription insights: Separating upgrades, downgrades, and refunds is difficult, and those distinctions matter for managing subscription revenue.
- Cancellation insights: Stripe shows when customers leave but not why they churn.
- Trial user tracking: There’s no clean way to separate trial users from paying customers.
- Customer profiling: The data is too limited for a full view of an individual customer.
- Customer segmentation: Granular segmentation is unavailable, so cross-referencing plans against churned customers is hard.
- Customer lifetime value: With no LTV data, sellers miss the single most important number for long-term growth.
The pattern is consistent. Stripe answers “did the payment work?” It struggles with “who is this customer and what are they worth?”
The metrics eCommerce sellers actually need
Payment analytics is only half the picture. Growing an eCommerce business depends on customer and product analytics that Stripe’s payment reports don’t cover.
The metrics that drive eCommerce decisions include:
- Customer lifetime value (LTV): The total revenue a customer generates over their relationship with your business. It sets your acquisition budget and flags your best segments.
- RFM segmentation: Grouping customers by recency, frequency, and monetary value to spot high-value, loyal, and at-risk buyers.
- Cohort retention: How a group of customers acquired in the same period keeps buying over time.
- Product performance: Which products drive first purchases, repeat purchases, and refunds.
- Average revenue per paying user (ARPPU): A cleaner growth signal than raw revenue when you’re changing pricing or plans.
None of these come from payment-performance reporting. They come from analyzing customer and order data, which is where Stripe’s native analytics reach their limit.
Google Analytics as a workaround (and why it’s tedious)
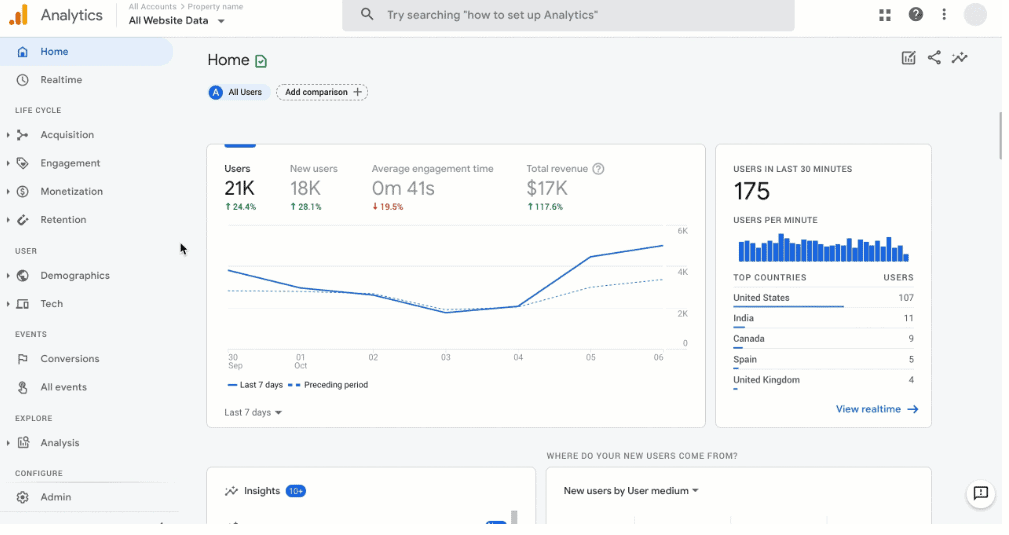
To close these gaps, some businesses connect Google Analytics to Stripe. It works, but it isn’t simple:
- You’ll need custom events for each purchase and webhooks to capture transaction data.
- Timezone mismatches and tracking discrepancies are common, especially with subscriptions and refunds.
Google Analytics is built for web traffic, not payment and customer revenue data. Bending it into a revenue analytics tool is doable, but it takes engineering time and constant reconciliation, which is more than most small teams want to take on.
A complete analytics layer for Stripe: Putler
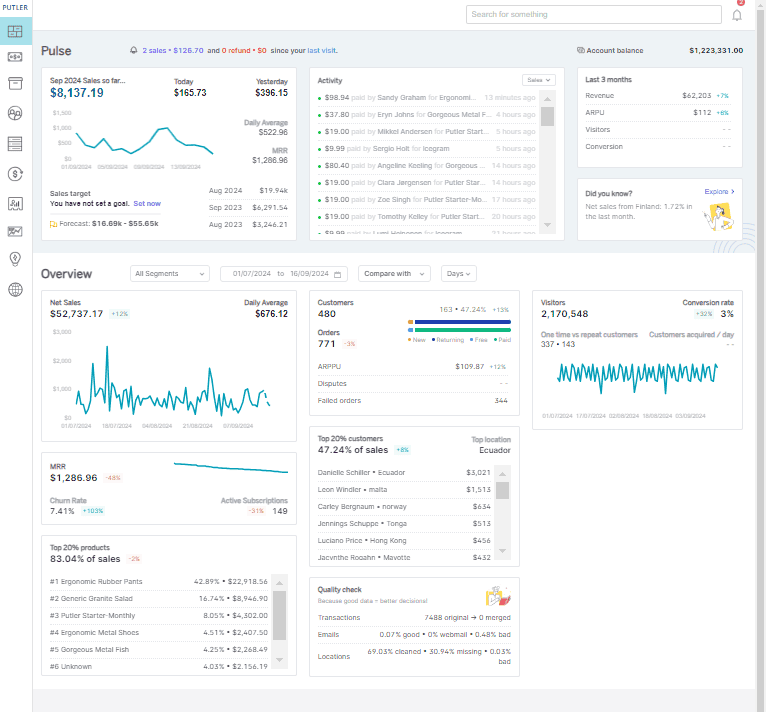
Putler sits on top of Stripe and adds the business-analytics layer Stripe’s native reporting doesn’t cover. It connects to Stripe in a few clicks and integrates with other platforms and gateways, turning payment data into customer, product, and revenue insight.
Here’s what it adds:
- Revenue forecasting: Putler analyzes historical sales to forecast future revenue, supporting proactive planning.
- RFM segmentation: Putler groups customers into high-value, loyal, and at-risk segments so you can see behavior patterns at a glance.
- Cancellation insight: Putler’s RFM analysis flags at-risk customers, and filters surface products with high refund rates.
- Trial vs paying clarity: Putler shows the exact count of trial users versus new paying customers, and filters separate new (including trials) from returning customers.
- Detailed customer profiles: Access individual customer data including transactions, orders, refunds, and revenue contribution.
- Refund management: Track refunds by name, email, or transaction ID, and issue a refund in one click.
- Subscription analytics: MRR, churn rate, and active subscriptions for a full view of subscription health.
- Activity log: A running summary of sales, refunds, and disputes for quick decisions.
- Geographic segmentation: Predefined filters including location-based segmentation for targeted strategy.
The distinction is simple. Stripe tells you how your payments are performing. Putler tells you how your business is performing. Used together, you cover both.
Stripe payment analytics vs a dedicated analytics tool
For a quick mental model:
Stripe native analytics is the payment lens. Acceptance rates, authentication, disputes, and fraud. Use it to keep the checkout healthy.
A dedicated analytics tool is the business lens. LTV, RFM, cohorts, product performance, and forecasting across every gateway. Use it to grow revenue.
Most eCommerce sellers need both. The payment lens keeps money flowing in. The business lens tells you where the growth is.
The takeaway
Stripe payment analytics handles the basics of payment performance well, and its 2026 upgrades made it stronger. But for eCommerce businesses that need to understand customers, products, and long-term revenue, the native reporting stops short.
Putler bridges that gap, building on Stripe’s standard metrics to reveal a fuller view of business health, so complex data becomes easier to read and decisions become easier to make.
FAQs on Stripe payment analytics
Does Stripe have analytics?
Yes. Stripe’s Dashboard includes payment analytics covering acceptance rates, authentication, and disputes, plus billing analytics like MRR for Stripe Billing users. In 2026 Stripe added a Dashboard assistant that investigates payment performance issues in natural language.
What are the limitations of Stripe analytics for eCommerce?
Stripe’s analytics focus on payment performance, not customer or product analytics. It lacks revenue forecasting, customer lifetime value, RFM segmentation, cohort retention, and clean trial-versus-paying separation.
How do I get customer lifetime value from Stripe?
Stripe doesn’t calculate LTV natively. You either export transaction data and compute it yourself, or connect a dedicated analytics tool like Putler that generates LTV and customer segments automatically.
Can I combine Stripe and PayPal data in one dashboard?
Not within Stripe. Stripe only reports on Stripe payments. To see Stripe, PayPal, and other gateways together, use a multi-gateway analytics tool that consolidates them into a single view.
Is Google Analytics enough for Stripe revenue reporting?
It can work, but it’s tedious. Google Analytics is built for web traffic, so tracking Stripe revenue requires custom events and webhooks, and subscriptions and refunds often cause discrepancies.