

Gumroad analytics gives you a reliable view of activity inside your Gumroad account. It shows what sold, where buyers came from, and how products converted. But it cannot give a multichannel creator the whole business picture on its own.
That distinction matters because checking a dashboard can feel like work even when it leads nowhere.
The underlying motive is usually reassurance: revenue moved, so you want to know why. You open Gumroad, then GA4, then another storefront, and leave with several numbers but no decision.
The practical question is sharper: which newsletter or post produced revenue, not merely visits? Answers often sit across several systems, each recording a different part of the sale.
No single magical dashboard fixes this. A clear rule for which source answers which question does.
Which analytics source should answer each question?
The best source depends on the decision: Gumroad records platform activity, GA4 observes acquisition events, and consolidated transaction data adds customer, product, and cross-channel context. Below, each question is paired with one starting source and the main caveat it carries.
| Question | Best starting source | Main caveat |
|---|---|---|
| How much did I sell on Gumroad? | Gumroad Sales Analytics | Covers Gumroad, not your full multichannel business |
| Where did a visit or purchase come from? | Gumroad UTM links and GA4 | Client-side tracking can miss events |
| Which customers and products drove the change? | Gumroad’s customer export for Gumroad-only questions; a consolidated sales and customer view once other channels are involved | A consolidated view can use only the data fields that your connected sources provide |
| What did I earn across every channel? | A consolidated transaction view | Every relevant source must be connected and cleaned |
| What do competing Gumroad products earn? | Public market-research estimates | Estimates are not private seller transaction data |
This source hierarchy keeps a tracking gap from becoming a revenue claim.
It also stops a public estimate from being treated as if it came from your own books.
What does Gumroad Analytics show?
Open Analytics and select the products and date range you want to study. Gumroad applies those filters to the sales chart, referrers, and locations.
Sales dashboard
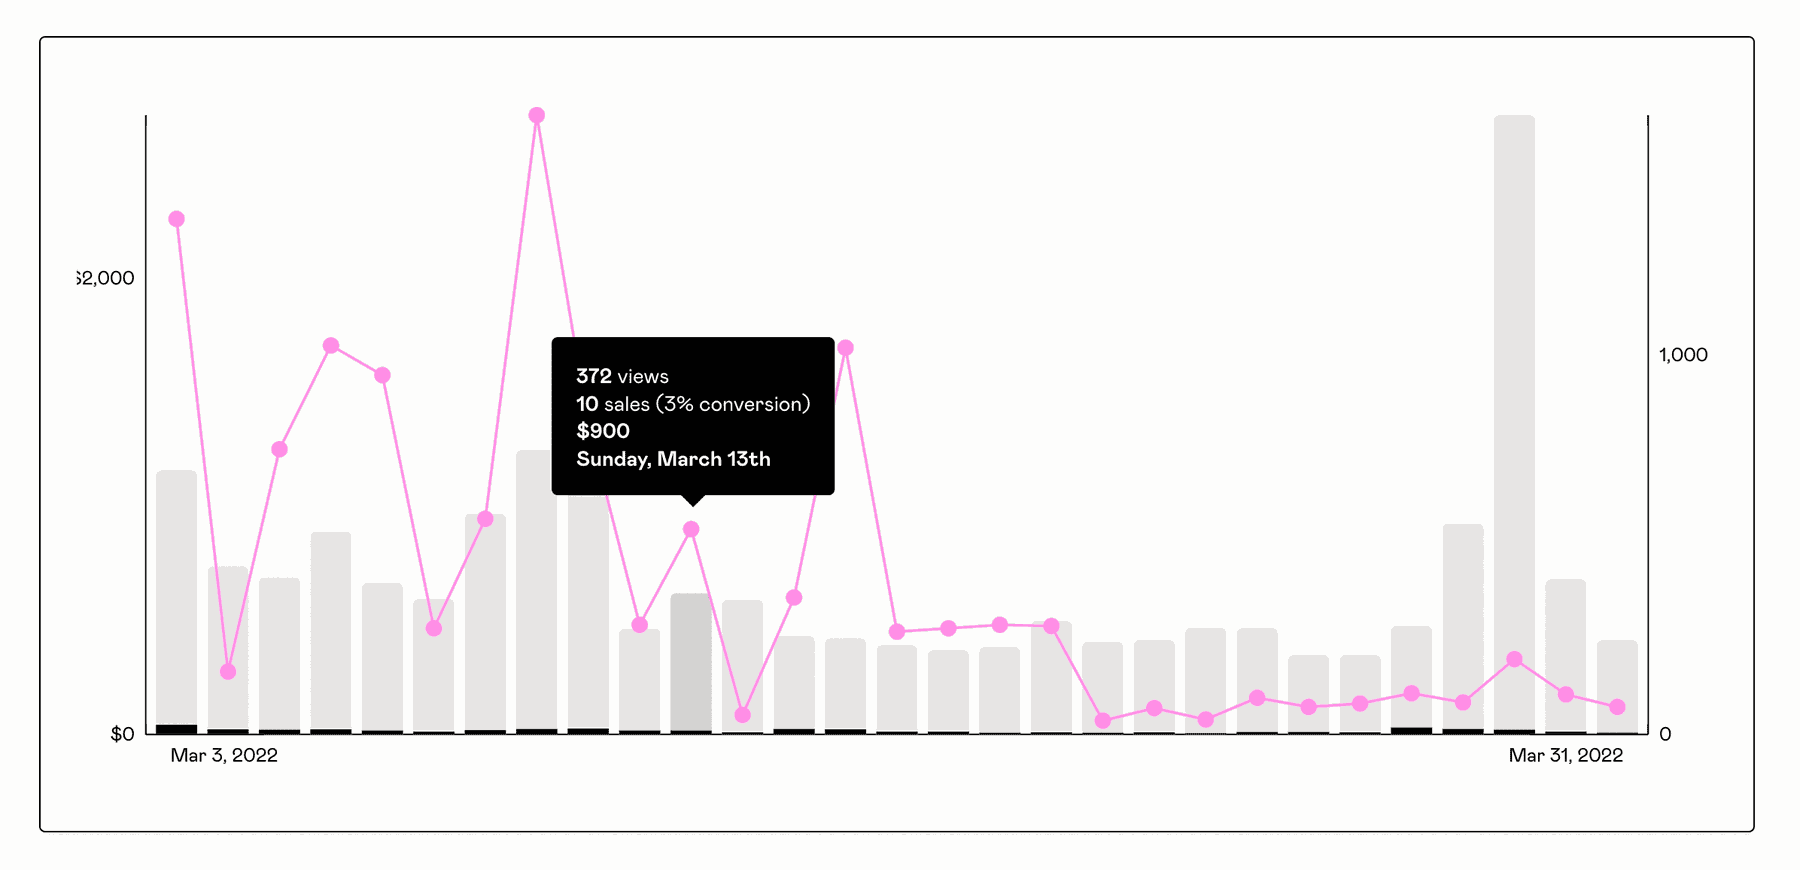
- Sales: Purchases completed.
- Views: Product-page loads.
- Revenue: Sales value.
- Conversion: Views that became sales.
- Trend: Hourly, daily, or monthly.
Churn dashboard
For memberships and subscriptions:
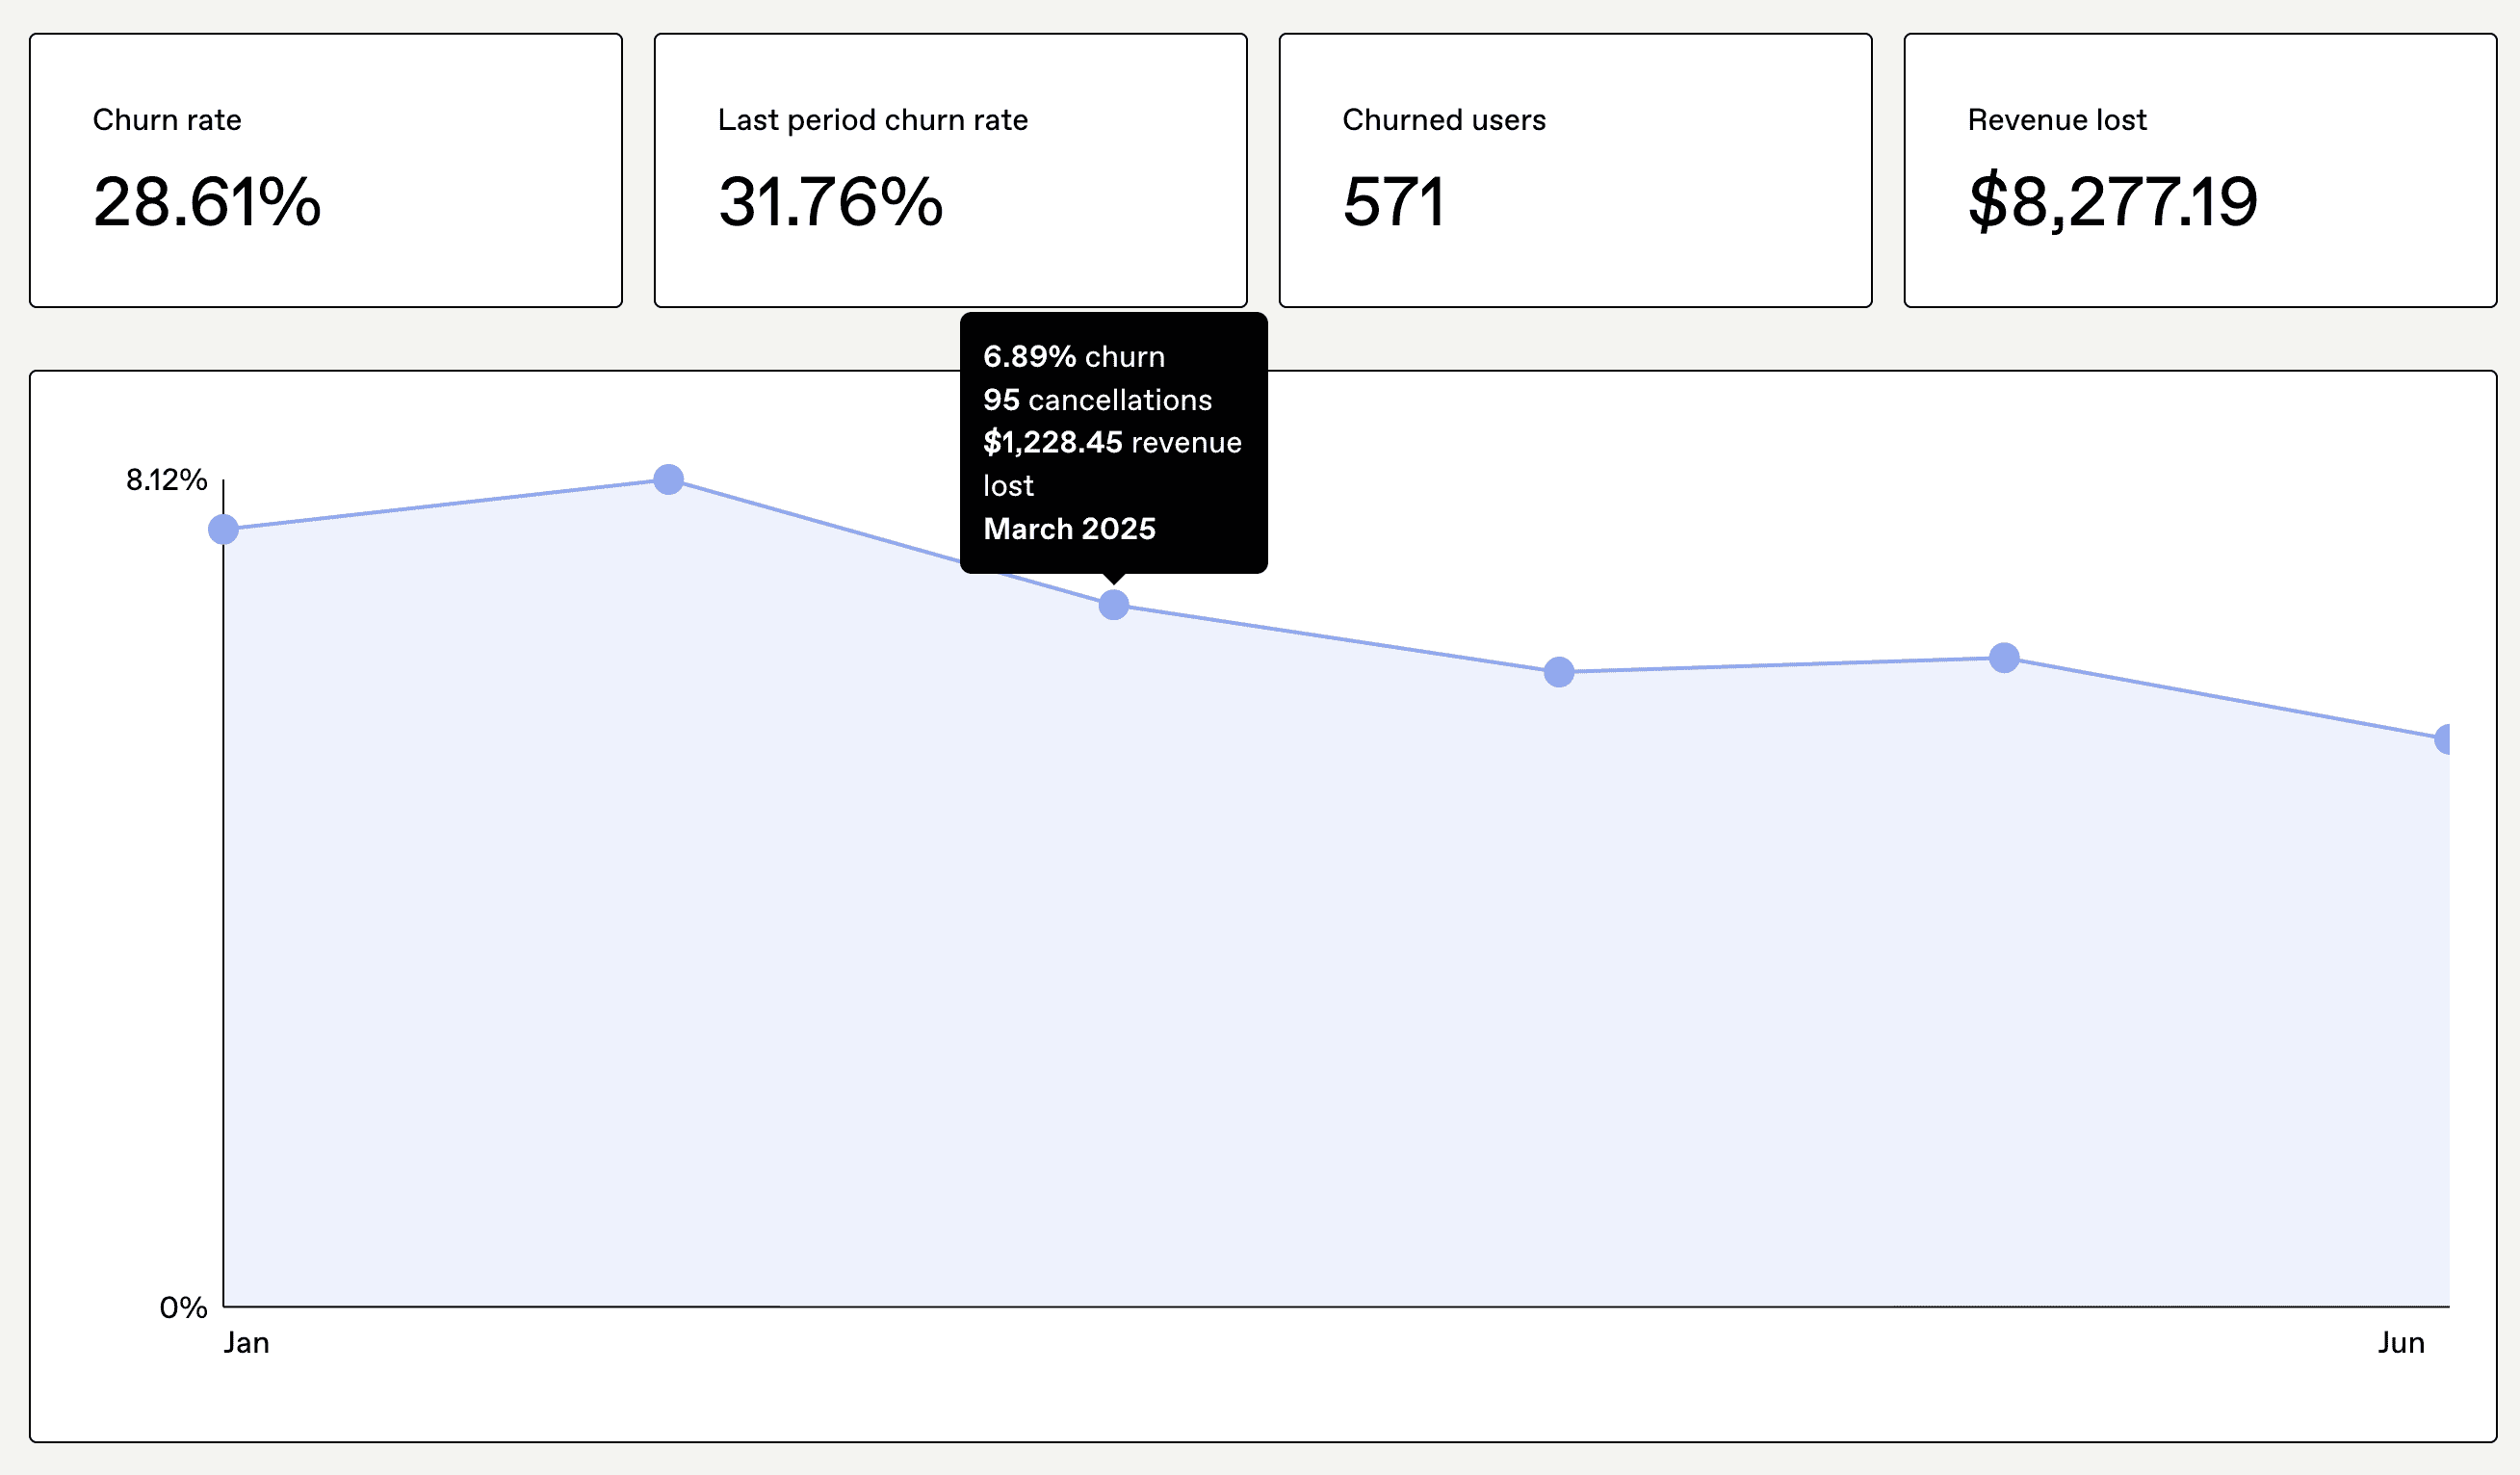
- Churn rate: Subscribers lost.
- Previous rate: Prior-period comparison.
- Churned users: Cancellations.
- Revenue lost: Recurring revenue lost.
Referrers
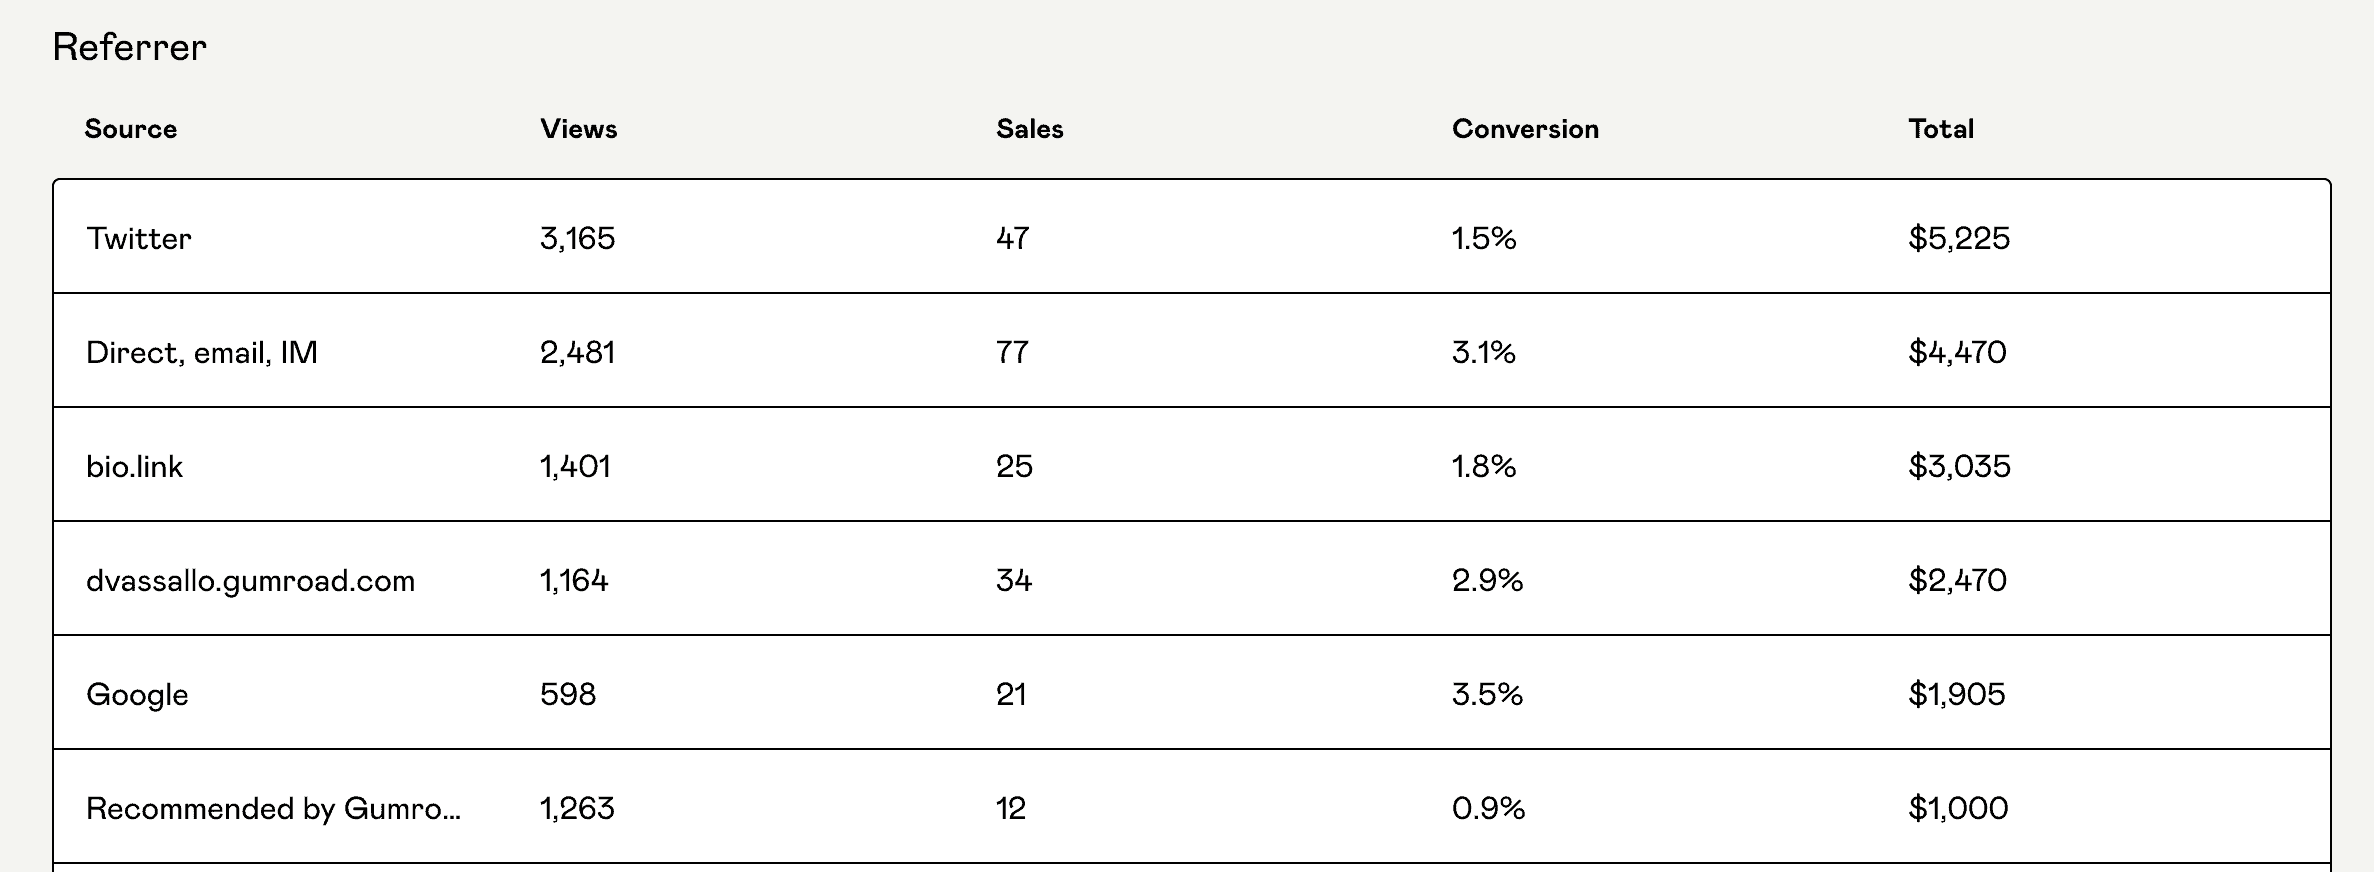
- Source: Where visits began.
- Views: Visits from that source.
- Sales: Purchases from that source.
- Conversion: Views that purchased.
- Total: Revenue from that source.
“Direct, email, IM” can include mobile apps, email, messaging apps, and some social clients.
Locations
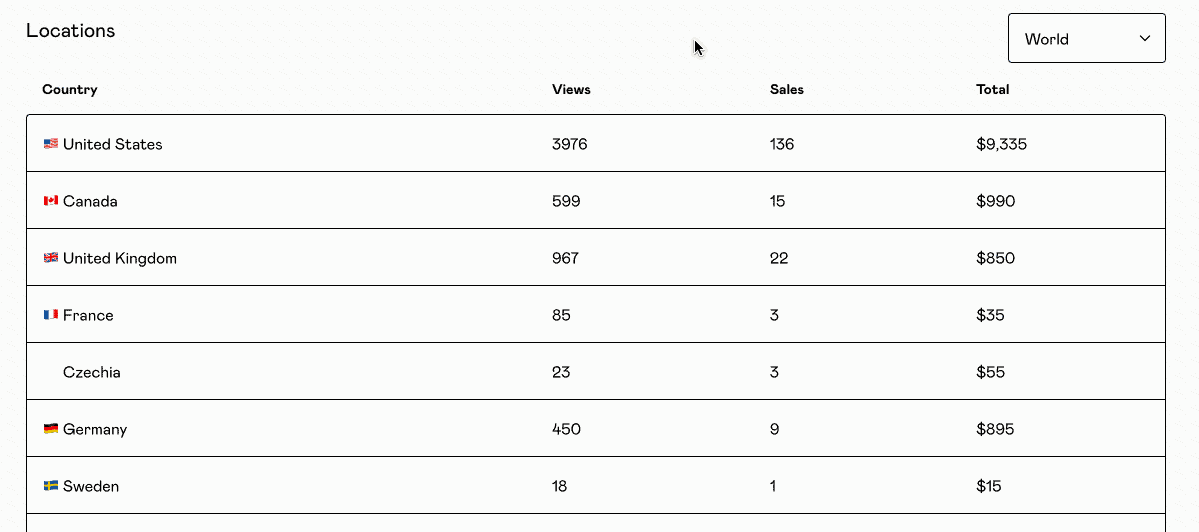
- Country: Approximate buyer location.
- Views: Product views.
- Sales: Purchases.
- Total: Revenue by location.
US sellers can switch from the world view to a state-level view.
UTM links
- Clicks: Unique link visits.
- Sales: Attributed purchases.
- Revenue: Attributed sales value.
- Conversion: Clicks that purchased.
Gumroad attributes a purchase for seven days after a UTM-link click. A product link tracks that product; profile, post, and subscribe links can track purchases across products. See Gumroad’s official Sales Analytics documentation for interface steps and CSV fields.
Why can the dashboard and CSV show different dates?
Gumroad displays Analytics and Customers data in your local time zone, while its sales CSV uses UTC. That difference can move orders across date boundaries.
Gumroad recommends adding a one-day buffer to both ends of an export range. This is a small detail, but it can save an hour of trying to reconcile two reports that are both behaving as designed.
When is Gumroad’s native data the source of truth?
Use Gumroad’s recorded numbers for Gumroad sales. Its own documentation warns that external scripts may not run because of privacy choices or blocking tools.
GA4 can therefore undercount purchase events even when Gumroad completed and recorded the transaction. Acquisition tracking explains a path. It should not overrule the platform’s sale record.
How should a reliable Gumroad analytics stack work?
A reliable Gumroad analytics stack has three layers: platform truth, acquisition signals, and consolidated decision context. Each layer answers a different business question. Gumroad holds the recorded sales, GA4 and UTM links explain how visitors arrived, and a consolidated view covers customers and products across channels.
Layer 1: Use Gumroad for platform truth
Start with Gumroad when the question stays inside Gumroad. This includes recorded sales, product views, conversion, referrers, locations, churn shown by Gumroad, and customer exports.
Native data is also the fastest way to check whether an apparent drop is real. If GA4 shows no purchase but Gumroad recorded one, you have a tracking problem, not a missing sale.
Layer 2: Use GA4 and UTMs for acquisition signals
GA4 helps explain how people reach and move through your Gumroad purchase flow. Gumroad currently sends three named product events: view_item, add_to_cart, and purchase.
Those events can show where a funnel loses people, especially when you use cross-domain tracking between your site and Gumroad. The third-party analytics guide covers the setup and event behavior.
Don’t ask GA4 to be your accounting system. A blocked script, a privacy setting, or a cross-domain setup error can remove an event without removing the actual order.
Layer 3: Use a consolidated view for cross-channel decisions
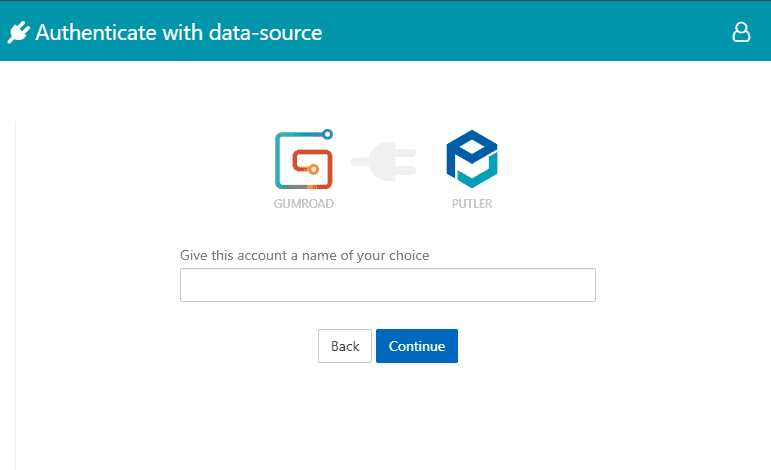
Putler connects directly to Gumroad through an authorization flow. After choosing Gumroad as a data source, sign in, grant permission, and let the connected data appear in consolidated Sales, Products, and Customers views.
The connection steps belong in the Gumroad integration documentation. The useful question here is what becomes possible once Gumroad sits beside other channels.
That is where consolidation earns its keep. A Gumroad total may be correct and still be incomplete if you also sell through another storefront or gateway.
What can native Gumroad analytics not answer alone?
Native Gumroad analytics cannot show the full customer, product, and revenue picture when a business spans other stores or payment sources. Four questions expose the gap: total earnings across channels, which customers to retain, which products to promote, and whether traffic became revenue.
That’s not a flaw in Gumroad. A platform dashboard is built to report what happens on that platform. The gap appears when you ask a business-wide question of a platform-level report.
What did you earn across every channel?
A creator selling through Gumroad and another storefront has at least two valid revenue reports. Opening both does not automatically produce one trustworthy total.
Currencies, time zones, refunds, and duplicate transactions can change the combined result. Gumroad’s own sales export shows how this happens: amounts stay in USD with a separate buyer-currency column, timestamps use UTC, and fees and net total have their own columns. Before you compare growth, you need to consolidate ecommerce data before analyzing it.
Which customers are worth retaining?
An order list tells you who bought. A customer view should help you see who returned, who spent the most over time, and who may be slipping away.
This matters because a seller’s instinct is often to chase the next new buyer. That feels like growth. Yet a small group of repeat customers may already be carrying more revenue than the latest campaign.
A consolidated customer view can include customer histories, lifetime value, and RFM segments. RFM groups customers by how recently and frequently they bought, and how much they spent, helping you identify valuable and at-risk customers.
Which products should you promote, bundle, or retire?
Product decisions need more than a sales total. You need to see revenue contribution, quantities, refunds, customer counts, and which products are often bought together.
A low-volume product can still be valuable if it brings strong revenue or leads buyers toward another offer. A high-volume product can hide a refund problem. Product analytics helps you decide which products to promote, bundle, or retire.
Did traffic become revenue?
Traffic and revenue answer different questions. GA4 or a UTM link can show that a campaign attracted attention; recorded transactions show whether that attention paid.
Keep the two sources separate long enough to trust each one. Then connect them for a decision such as increasing a campaign budget, changing a landing page, or dropping a channel that sends clicks without buyers.

How do you run a 15-minute Gumroad analytics review?
A useful weekly review answers five questions in order: what changed, which product moved, which customers responded, which channel contributed, and what action follows. Each answer sets up the next question, and the review ends with one written action for the week ahead.
Treat this as a working routine, not a universal benchmark. Fifteen focused minutes can be more useful than opening the same dashboard six times during the week.
What changed?
Compare revenue, orders, refunds, and conversion with a relevant prior period. Use the same date length and check for launches, promotions, or holidays that make the comparison unusual.
Don’t react to one dramatic day. A single large order can make growth look healthier than the underlying order count, while several small refunds can make a steady week look worse.
Write one sentence that names the change. For example: “Revenue rose, but the number of orders stayed flat.” That statement gives the next check a job.
Which product caused the change?
Check which product contributed the revenue, whether its quantity changed, and whether refunds moved with it. Look at products bought together when that data is available.
Suppose revenue rose while order count stayed flat. A higher-priced product may have sold more, or an existing bundle may have lifted order value. The response is different from a traffic surge, so do not jump to campaign changes yet.
Which customers drove the change?
Separate new buyers from returning customers. Then check whether a small group of high-value customers produced an unusual share of the week’s revenue.
You don’t need to label every person. Pick one useful group: new buyers who need onboarding, repeat buyers who may want a related product, or previously active customers who have stopped purchasing.
If you use RFM segments, keep the message tied to the segment’s behavior. “At risk” should lead to a relevant reason to return, not the same discount sent to everyone.
Which campaign or channel influenced it?
Use Gumroad UTM reports and GA4 to check which source, campaign, or landing page contributed visits and purchases. Keep Gumroad’s recorded sales as the transaction reference.
Gumroad’s documentation says the “Direct” referrer can include email, mobile apps, and instant messengers, so a newsletter click without a UTM link may not show up as a newsletter.
Look for a decision, not a flattering chart. If a newsletter sent fewer visits but more buyers than a social post, raw traffic should not decide next week’s effort.
What action happens next?
End the review by assigning one action. Adjust a campaign, investigate a refund pattern, build a bundle, contact a customer segment, or stop promoting a weak product.
Write the action beside the observation that caused it. Without that link, the dashboard becomes a weekly ritual for reducing anxiety rather than improving the business.
When is Gumroad’s native dashboard enough?
Gumroad’s native dashboard is enough when sales stay mainly on Gumroad and a seller needs clear product, conversion, referrer, location, churn, and export data. Sellers whose questions cross stores, gateways, customers, or product catalogs reach the dashboard’s limit much sooner than single-channel sellers.
Add GA4 and UTM links when you need to understand acquisition paths. Add a consolidated analytics layer when your questions cross stores, gateways, customers, or product catalogs.
That means Putler is not the automatic answer for every Gumroad creator. A new seller with one product and one channel may gain more from setting consistent UTM links than from adding another tool.
A multichannel seller faces a different problem. Checking Gumroad, another store, and multiple gateways separately makes it hard to see one revenue total, one customer history, or one product picture.
Subscription reporting needs a separate check. The Subscriptions dashboard documentation does not list Gumroad among its supported sources, while the Gumroad integration page mentions SaaS reports. Confirm the metrics available for a connected Gumroad account before relying on MRR or churn figures.
Frequently asked questions about Gumroad analytics
What does Gumroad Analytics show?
Gumroad Analytics shows product views, sales, conversion rates, referrers, customer locations, and sales value across selected products and dates. It also includes subscription churn where Gumroad provides it, customer sales exports, and UTM link reports for campaign clicks, attributed sales, revenue, and conversion.
Can you connect Google Analytics to Gumroad?
Yes. Gumroad supports GA4 and sends view_item, add_to_cart, and purchase events for product activity. Cross-domain tracking can follow movement from your website to Gumroad. Client-side events may be blocked, so use GA4 for acquisition analysis and Gumroad’s records for completed Gumroad sales.
Why do Gumroad and GA4 report different sales numbers?
GA4 depends on browser scripts that privacy settings, blockers, or tracking errors can prevent from running. Gumroad records the transaction on its own platform. When purchase totals differ, trust Gumroad for recorded Gumroad sales, then diagnose GA4 as a tracking issue.
Can you connect Gumroad directly to Putler?
Yes. Putler provides a direct Gumroad data-source connection. Select Gumroad in Putler, name the source, sign in to Gumroad, and grant permission. Use Putler’s documentation for current setup steps, and confirm any field-level or plan-specific requirement before relying on it.
What is the best analytics setup for a multichannel Gumroad creator?
Use Gumroad for platform sales, GA4 and UTM links for acquisition signals, and consolidated transaction analytics for cross-channel customer and product decisions. This setup preserves each source’s strengths and prevents missing browser events or public market estimates from replacing recorded revenue.
What should you do next?
If Gumroad is your only sales channel, start small. Create consistent UTM links, confirm GA4 only if you need acquisition detail, and run the five-question review every week.
If you sell through Gumroad and other channels, connect the sources you need before comparing performance. Then choose one cross-channel question, such as which products drive repeat purchases, and build the review around it. The 14-day free trial is one way to test that with your own Gumroad data.
By the next review, the distance between seeing a change and deciding what to do about it should be one written line.