
Have you newly started your online business? Or perhaps your business is already well-established online? Either way, there will be tons and tons of data at your fingertips.
Today, almost all businesses rely on business analytics tools to process data for them and generate intelligent insights that can help to grow sales, leaving behind frustrating time-consuming manual work.
Your choice of software is predictably long and varied … Putler, Baremetrics, ChartMogul, GetControl … the list goes on and on.
But one tool that grabbed our attention was ChartMogul. So here’s a Chartmogul review plus an added bonus a Chartmogul alternative as well.
In this review, you will find everything about its features, pricing, demo,as well as a head-to-head comparison of ChartMogul with Putler.
Read below to find out…
A SaaS Metrics Tool?
“Build a better subscription business”. ChartMogul’s tagline gets straight to the point, making it clear that it’s a tool useful for subscription-based businesses. It’s a ‘software as a service’ (SaaS) analytics software.
You will find all of the usual SaaS metrics such as monthly recurring revenue (MRR), customer churn rate, annual run rate (ARR) and so on.
Hence, if you run a business that does not rely on subscriptions, these metrics will not be much beneficial.
ChartMogul API & Integrations – Braintree, PayPal,…
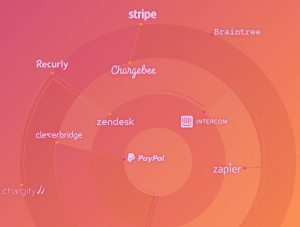
ChartMogul’s pre-built integrations include:
- Three payment gateways – Stripe, Braintree, PayPal,
- Four recurring billing solutions – Chargify, Recurly, GoCardless and Zuora.
In addition, it also has a range of application programming interfaces (APIs) for custom integration. So, if you are using other services than those mentioned above, ChartMogul API is what you need.
Essentially, it allows you to connect to your desired service, see important metrics and make further decisions.
Next up, it’s the ChartMogul’s exciting features…
ChartMogul Features – Consolidation, Reporting, Analytics…
Consolidation
You can connect multiple data sources (billing systems) into ChartMogul. Let’s say you want to connect one Chargify account and other Recurly account into ChartMogul to view data.
However, once you have connected multiple data sources, ChartMogul does not allow you to observe metrics for individual billing systems.
Instead, you would see accumulated, aggregated MRR data in your dashboard. (A combined stats of Chargify & Recurly and not separate data of each entity).
Currency Conversion
ChartMogul supports an impressive 169 currencies.
A primary currency is set in your account for reporting your revenue, but if a customer invoice is billed in a different currency, it will automatically convert the MRR amount to your account’s primary currency.
This handy tool does away with the laborious task of checking daily exchange rates as it does it all for you.
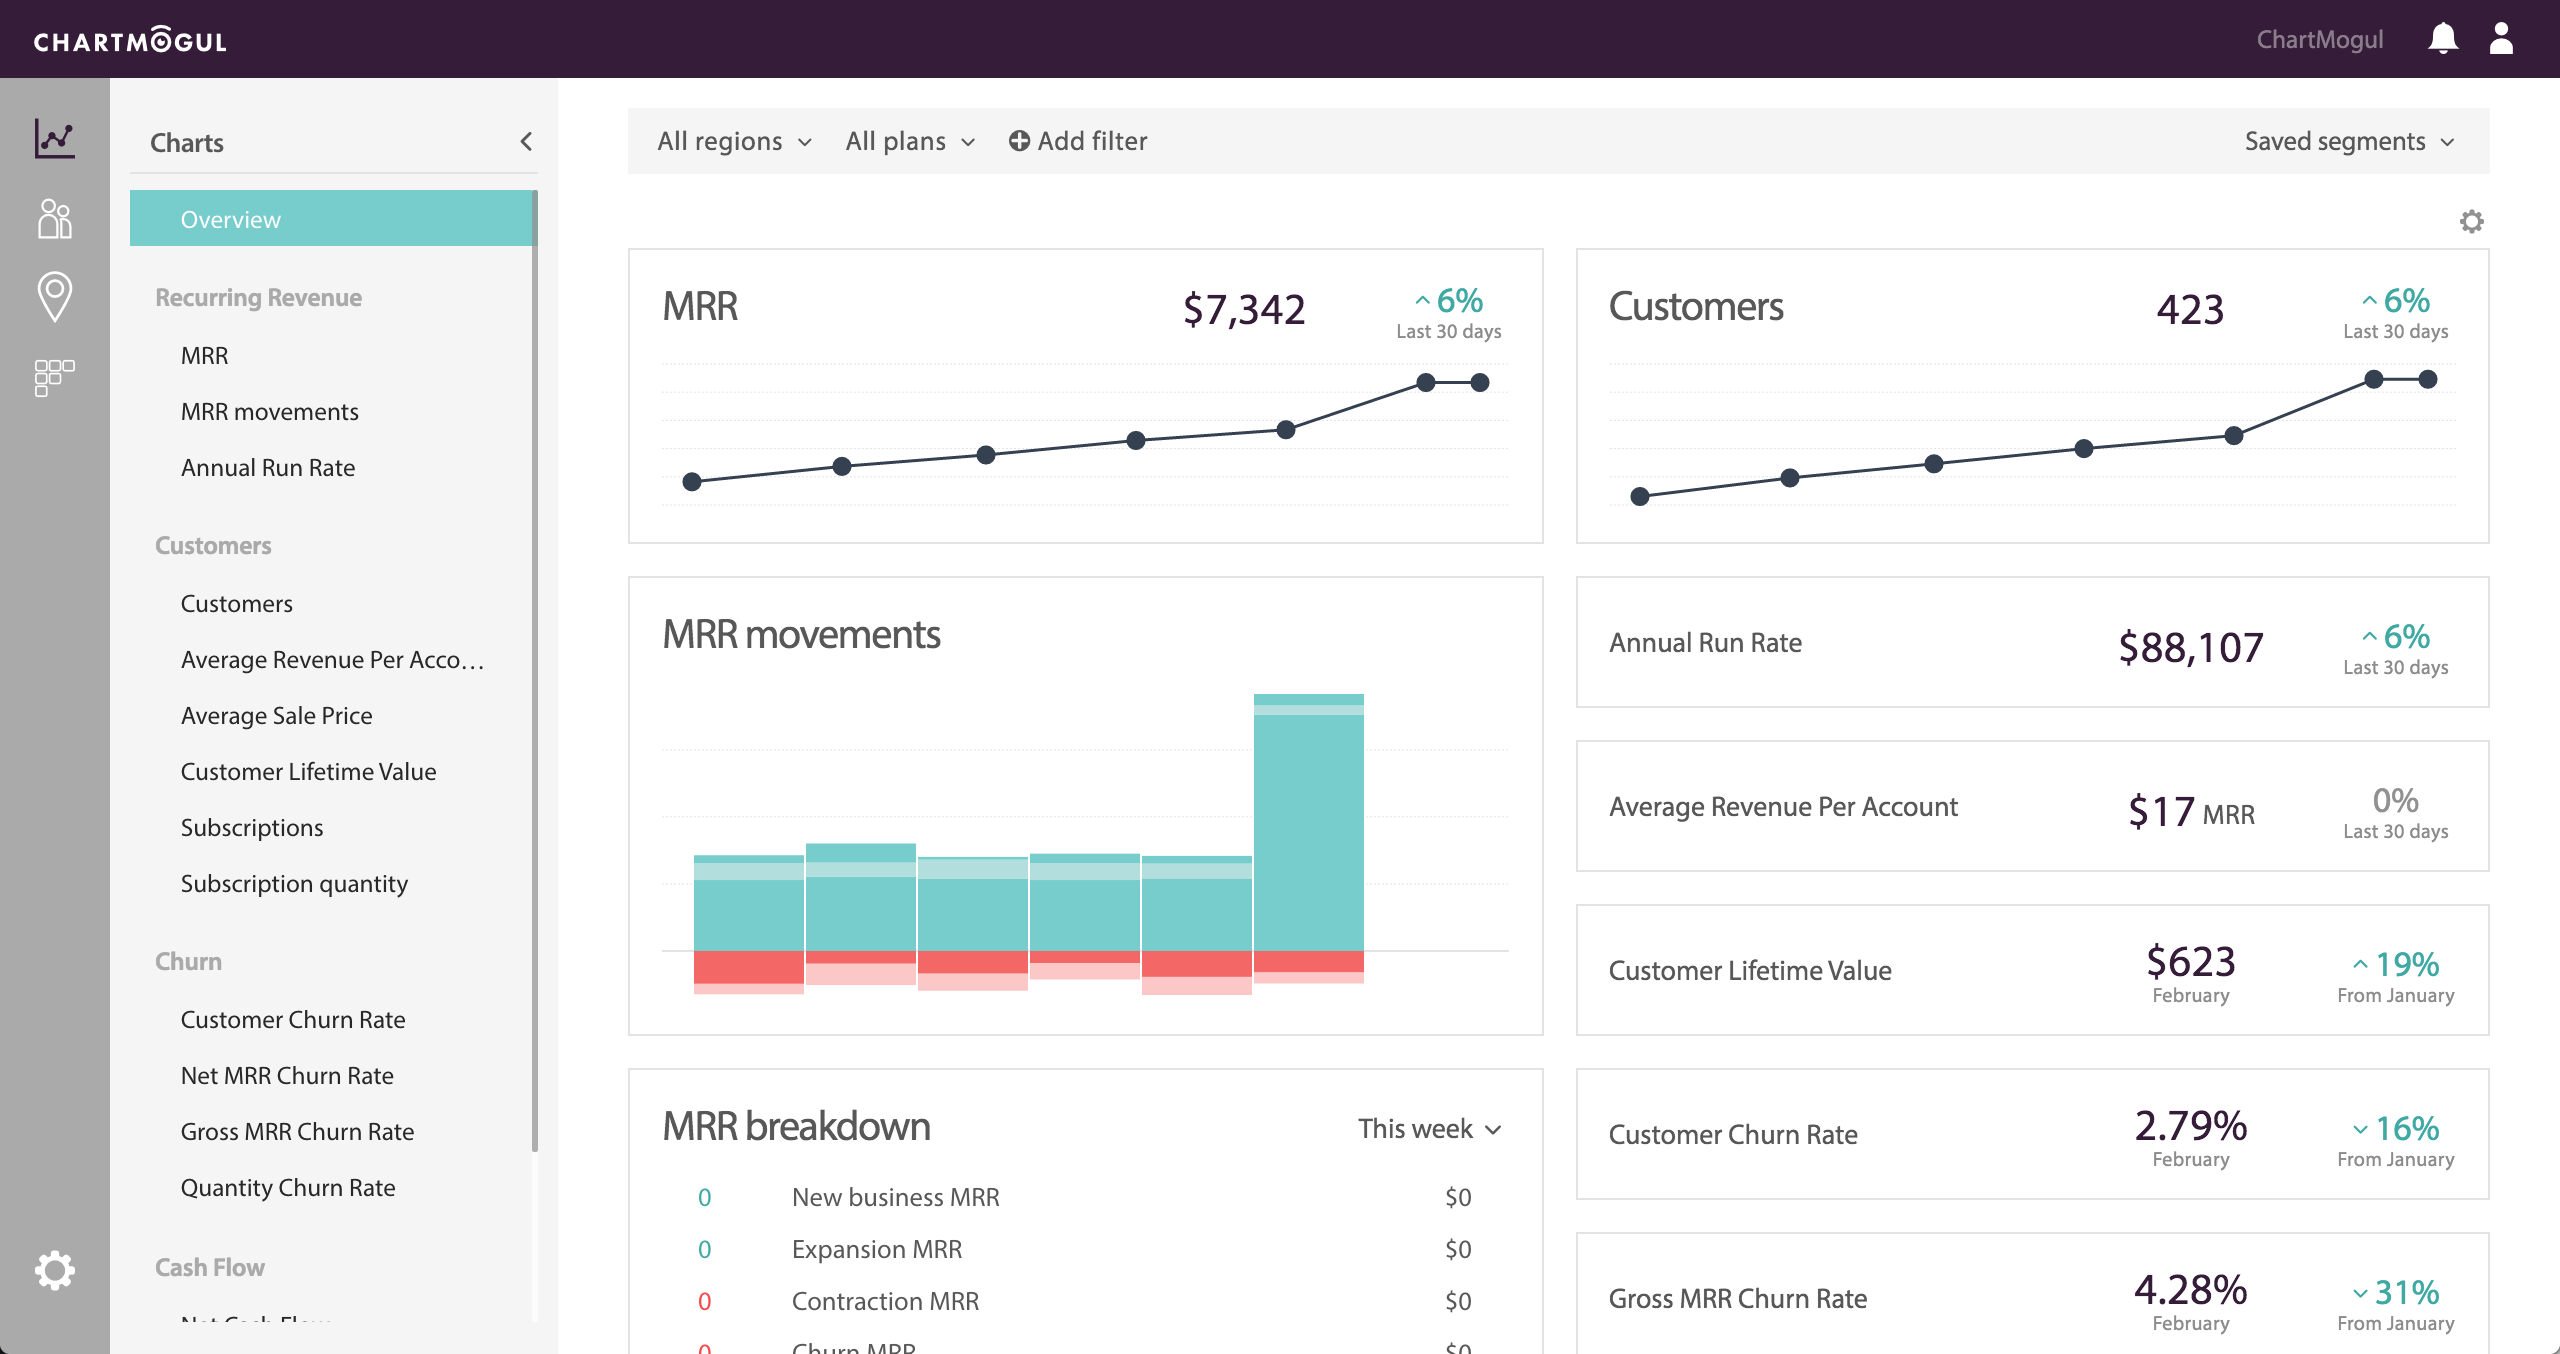
Metrics Reporting
Its primary function being a subscription software, the ChartMogul dashboard provides important subscription metrics. They have divided their metrics into 3 broad categories for easy, digestible understanding:
- Management & Investor – Monthly Recurring Revenue (MRR), Average Revenue Per Account (ARPA), Customer Lifetime Value (LTV), Average Sale Price (ASP), MRR Movements, etc.
- Marketing & Customer Success – Retention Cohort Analysis, MRR by Marketing Channel, Retention Rate by Sales Rep, Lead Volume, etc.
- Finance – Gross Cash Flow, Net Cash Flow, Refunds, etc.
Segmentation
Segmentation forms the core part of ChartMogul reporting and analytics.
Using segmentation, you can compare performances of your different customers segments based on various customer attributes over a period of time.
Customer attributes are data-points that can be used to create and filter segments. These attributes may be MRR, churn rate, currency, subscription quantity, etc.
For example, as shown in the above image users can compare MRR contribution from three different lead sources, allowing you to check whether MRR acquired from Direct traffic is greater than SEO and social traffic.
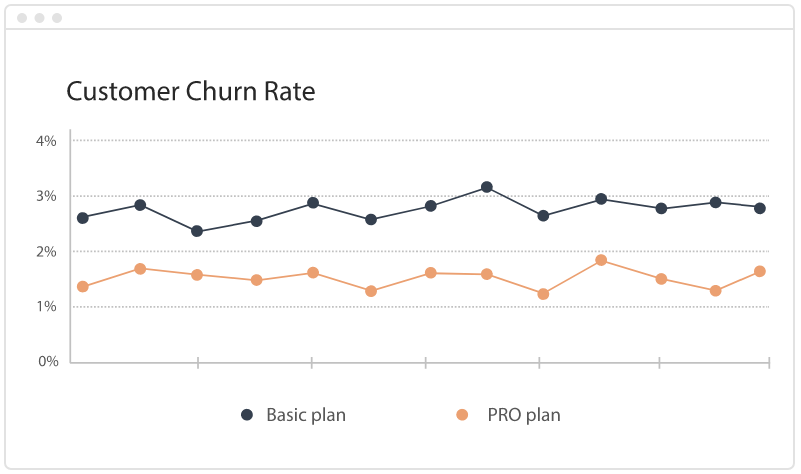
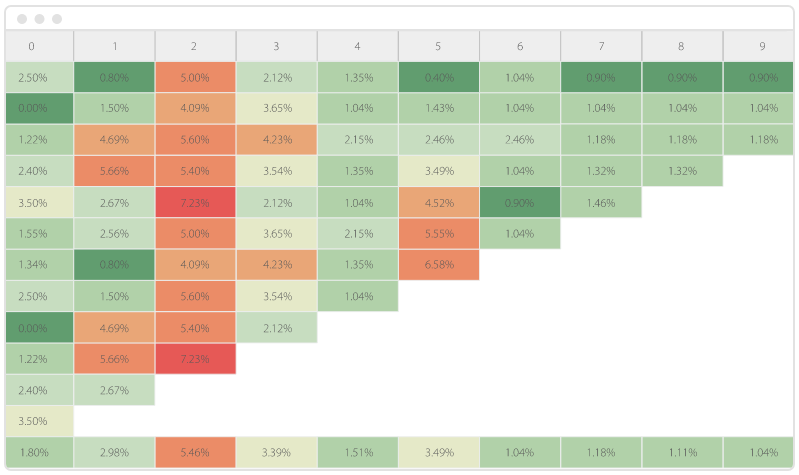
Or what impact does churn rate have on your various pricing plans as shown in the image below.
ChartMogul has done a solid job here by giving provisions for comparison of various segments for different attributes.
Geo-mapping
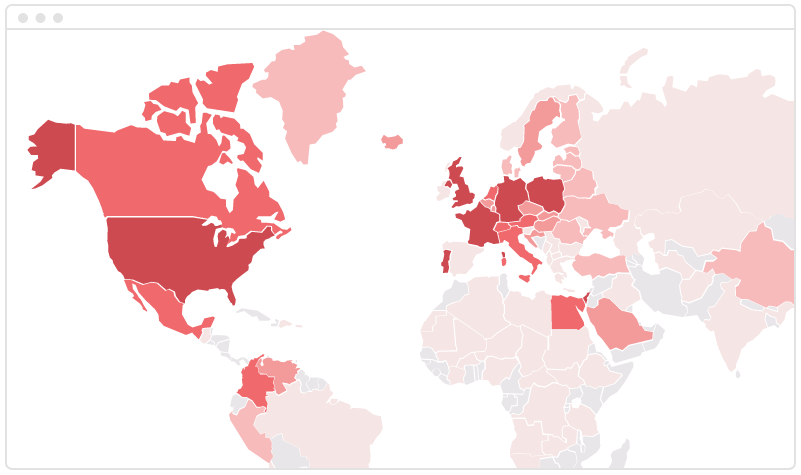
Using the geo-mapping feature, you can study customer behaviour in various countries. It allows you to create and filter customer segments and identify growth opportunities from different countries.
It will answer your questions such as:
- Customers contributing to maximum revenue stays in which country?
- From which country is customer churn rate the lowest?
- Is your MRR lower in large markets?
These are just a few of the intelligent insights you can derive from this intuitive feature.
Cohort Analysis
Cohort analysis lets you study the behaviour of a particular group of customers and how they evolve over time.
Be it net MRR churn, quantity churn or customer retention, you can analyse cohorts for any of these metrics.
As with geo-mapping, you can create and filter segments and study customer behaviour.
Email Notifications
If you are a ChartMogul user and have set some parameters for your business, you will receive notifications via email.
For example, let’s say you have set a parameter for when MRR reaches $500. Whenever you cross that value, you will be emailed a notification.
MRR Movements
These MRR is related with the customer behaviour in subscription plans. Did a new lead get converted for the first time? Or whether a customer downgraded his plan? These questions, and more, can be answered with this handy feature.
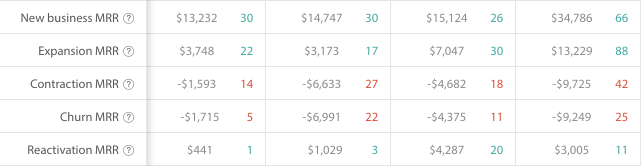
A total of five MRR categories are available, as well as the total value with activities for different customer segments.
- New business MRR – The MRR at the moment when a lead converts into a paid customer for the first time.
- Expansion MRR – Any increase in the MRR of an existing customer; like upgrade to a higher plan or adding a 2nd subscription.
- Contraction MRR – Any decrease in MRR; like downgrade to a lower plan or a discount being added.
- Churn MRR – The MRR at the time a customer cancels their subscription. A customer only counts towards Churn MRR if they don’t have any other active subscriptions.
- Reactivation MRR – When a previously paying customer that had churned moves back onto a paid plan.
Again, full marks to ChartMogul for this feature.
Now we move on to perhaps the most important part of the review…
ChartMogul Pricing
ChartMogul’s pricing plans are based on number of paying customers your business has. So, in this case, size matters:
There are 3 plans on offer:
- Free (Limited to $10K in MRR)
- $100 / month (per 1,000 paying customers / per month)
- Custom plan (> 10000 paying customers)
The free plan consists of good number of features except for email support, cohorts and geo-mapping. These features are available in the higher plans.
But, ChartMogul does offer a 30 day free trial.
ChartMogul alternative – Putler
For those who entered late, Putler is an all-in-one e-commerce reporting and analytics tool that helps any online business grow sales.
Compared to ChartMogul, Putler has a lot of unique features. Let me take you on a walkthrough:
Not only subscriptions..
Putler is for all online businesses; whether they are based on subscriptions or not. Online retailers, distributors, SaaS, accountant, etc.
You get all important SaaS metrics as well as other customer metrics, visitor and product metrics.
Some of them are MRR, ARPU, best-selling products, top customers, top web pages, etc.
15+ Integrations – PayPal, Stripe, WooCommerce…
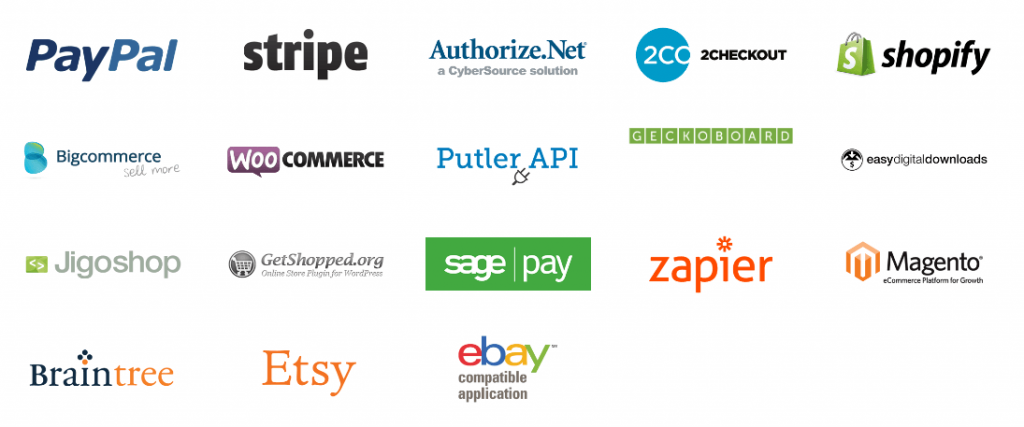
Putler began with PayPal integration and since then hasn’t stopped adding more! Today, Putler directly integrates with 15+ services that includes:
- Top payment gateways like PayPal, Stripe, Braintree
- Top shopping carts like Shopify, WooCommerce, Magento
- Ecommerce platforms like eBay, Etsy
- Google Analytics
and many, many more..
In addition, if you wish to connect any other service then the one’s mentioned above, Putler API is what you need.
Reporting & Analytics
Consolidation & Deduping
Using Putler, you can connect multiple business accounts.
The advantage here is that you can see individual stats for each of your business performance.
Putler has an automatic deduping process which removes the annoying and potentially misleading data duplication that arises when you connect multiple data sources. The great advantage of this is that it gets rid of any worries about inaccurate data.
Currency Conversion
Putler also supports multiple currencies. Just like ChartMogul, Putler automatically converts currencies to give you a global, single currency dashboard — whether it’s dollars, euros, pounds, or rupees.
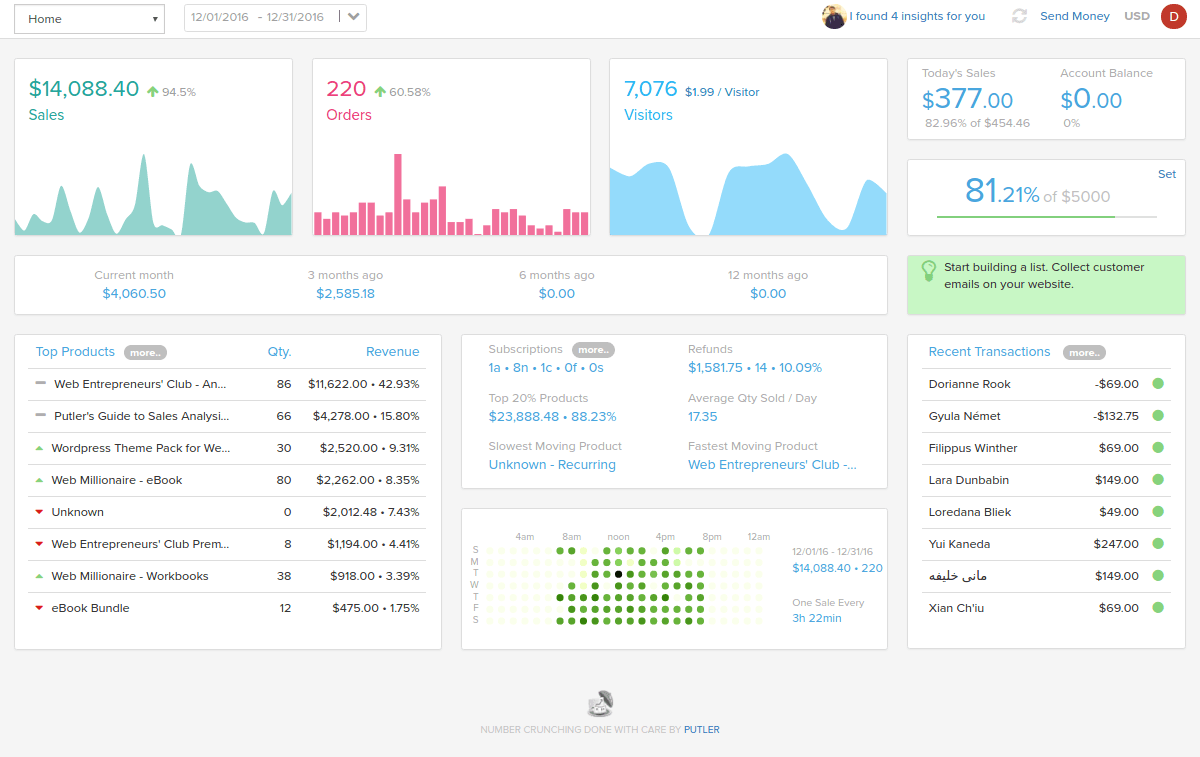
6 Unique Dashboards, 153+ metrics
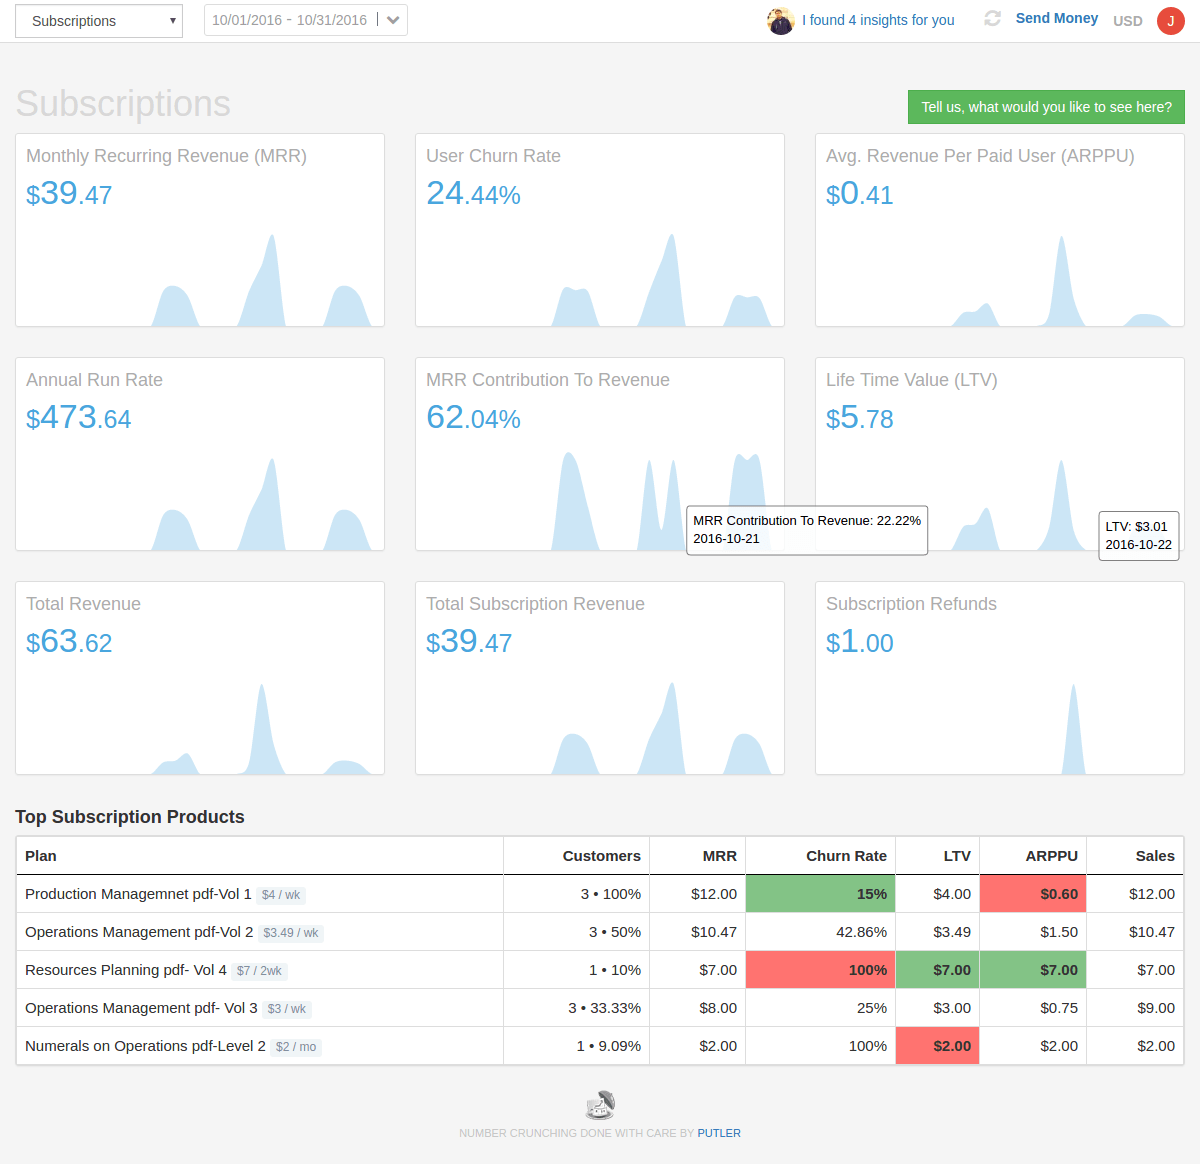
Using Putler, you get an overall business picture as well as individual dashboards.
Putler metrics are distributed within 6 in-depth dashboards, covering all of the important metrics and key performance indicators (KPI”s):
- Sales dashboard: Time-wise sales, refunds, orders, monthly target, best time for maximum sales, etc.
- Subscriptions dashboard: MRR, Churn, ARPU, LTV, etc.
- Transactions dashboard: Fees, taxes, type of payment, etc.
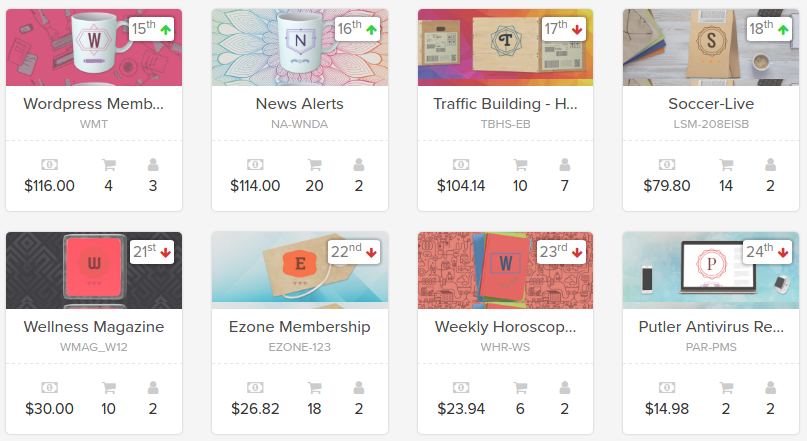
- Products dashboard: Product leaderboard, top 20% products, best and worst sellers, etc.
- Customers dashboard: Name, address, returning customers, etc.
- Visitors / Audience dashboard: Top pages, search terms linking to your website, bounce rate, revenue from different countries, etc.
These dashboards give you all of the essential data you need for your business to grow. Select any dashboard, click on a particular element and you will get every last detail.
Customer Profiles & RFM Analysis
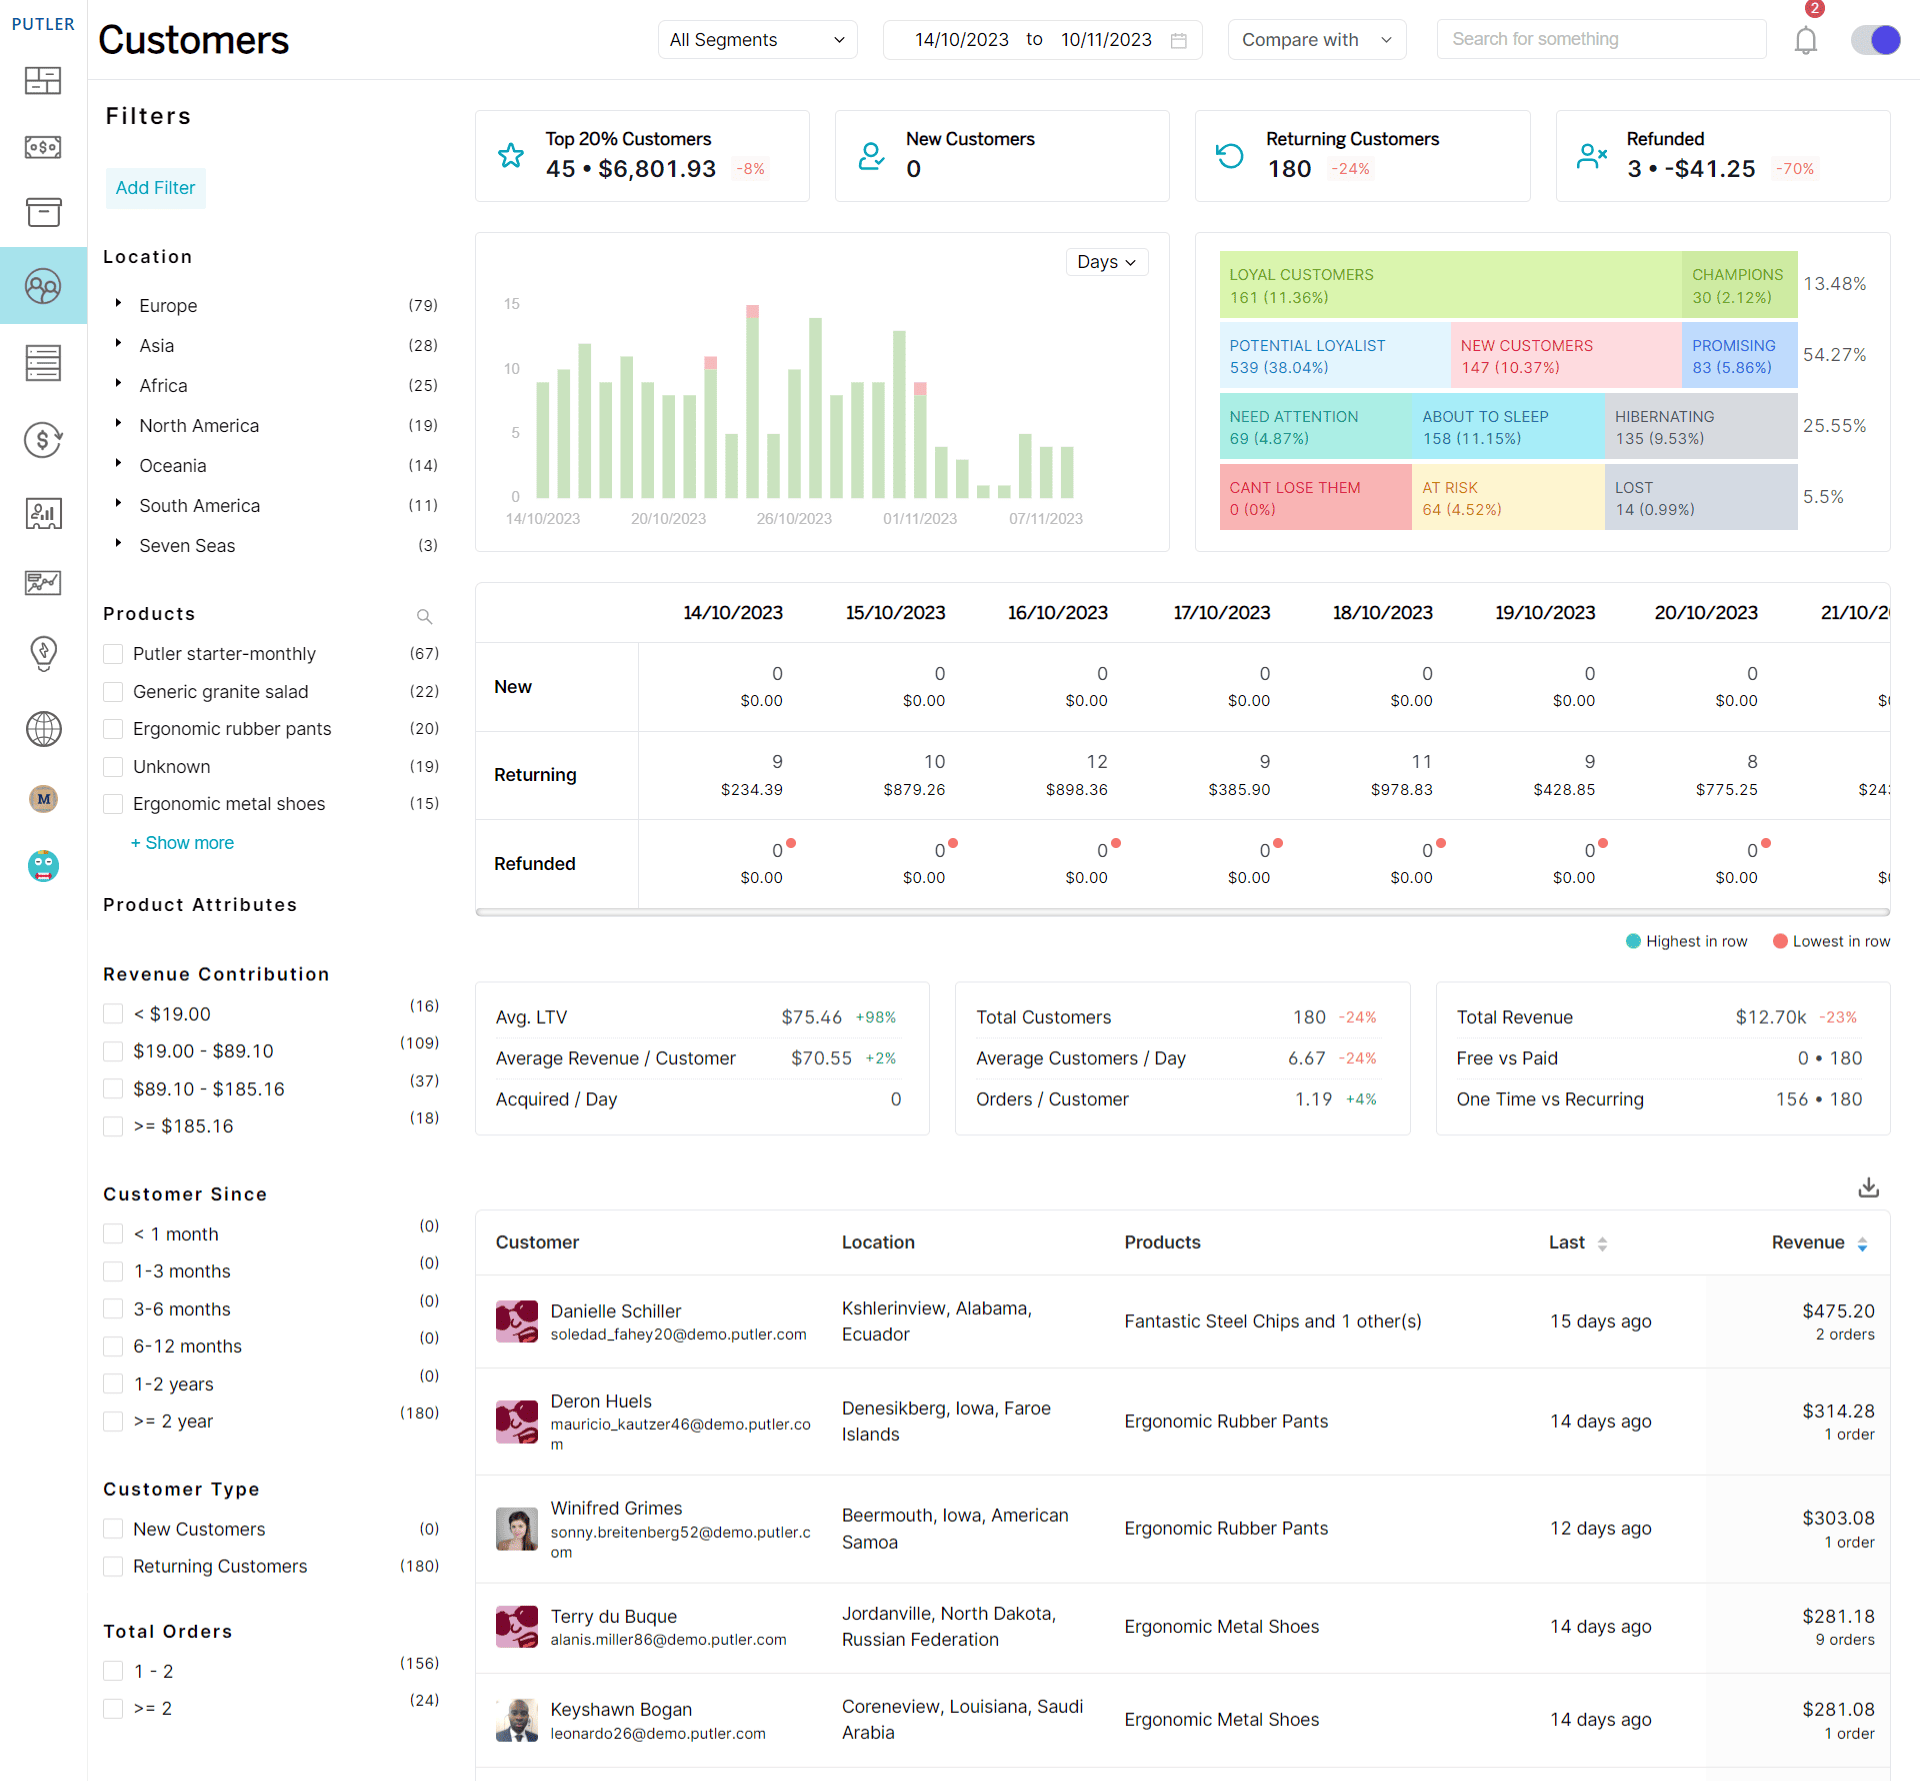
Get to know a complete profile of all your customers, including name, address, transaction details, etc.
Learn whether the customer is a loyal customer or on the verge of churn.
Putler provides various customer segments based on RFM analysis and gives you solid insights about every customer’s interaction with your store.
Find out whether once your loyal customers are on the verge of churn or not.
Or whether, your new customers count has increased far more than your existing customers using RFM analysis.
Managing subscriptions & refunds
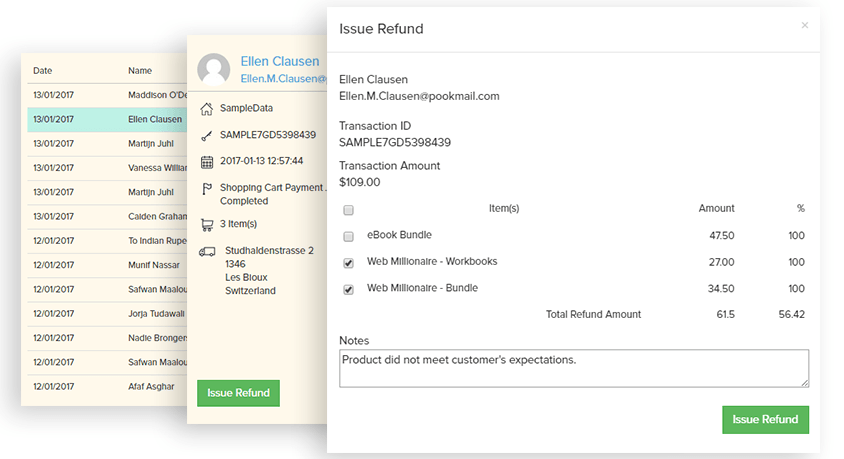
Bid farewell to the tedious process of managing subscriptions of payment gateways.
With Putler, you can easily manage this laborious area of business: suspend, cancel, reactivate and refund recurring payment subscriptions at the touch of a button.
Another incredibly useful and easy tool within Putler is that in just two clicks you can issue a refund to the customer. You can even select which products to refund, or what % to refund.
Send Money
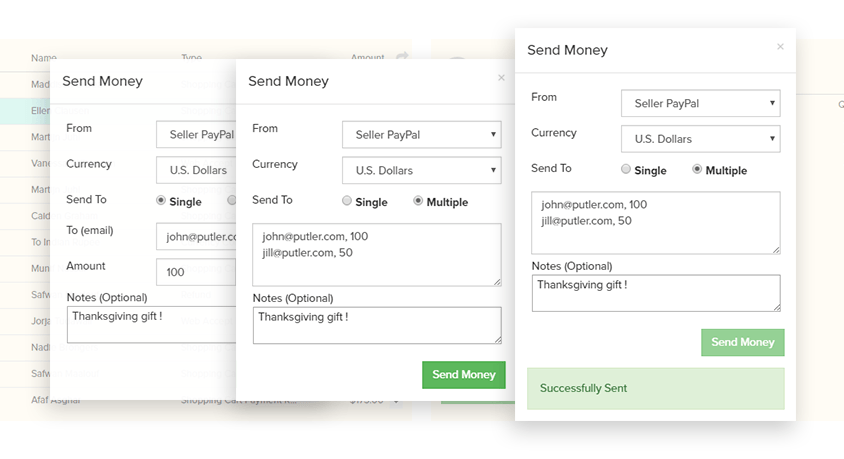
Want to build customer loyalty by giving store credits or transferring money? Use Putler’s send money feature. For this, a PayPal account is required for both sender and receiver.
In addition to the above mentioned, Putler has other lots of unique features.
Putler Pricing
Putler has 3 pricing plans suitable for any size of online business.
The pricing varies as per number of integrations and number of transactions.
- Plus: $25/month (3 integrations)
- Pro: $75/month (7 integrations)
- Max: $250/month (25 integrations)
There is also 14 days free trial. As you can see, in addition to the extra, unique features, the price point is a huge benefit of Putler.
The minimum plan allows for up to 1000 transactions per month, the Pro plan limit is 2500 transactions/month, while Max plan allows for unlimited transactions.
Liked Putler?
…And Finally, The Conclusion
ChartMogul has its share of advantages, but we must acknowledge its limitations. This software is built purely for subscription businesses. Features like segmentation, comparison of segments, cohorts, MRR movements and integrations with platforms makes it a good software for subscriptions businesses.
But ChartMogul lacks in many areas. We’ve already said that it is not much for non-subscriptions businesses, but in addition to this, features like RFM analysis, subscription management, customer profiles, insights, etc. are missing. Add to this the high pricing for even the most basic plan and value for money becomes an issue.
Meanwhile, Putler has been a crowd favorite for the past 6 years, and one of the most trusted business analytics and reporting solution for all online businesses. It is committed to continuous improvement, and more features will be rolled out soon.
Overall, a good user interface, engaging dashboards, valuable metrics, integrations and features makes Putler a relatively simple and comfortable software for users to gain a better insight and have a good understanding of their businesses.
What’s Your Take?
This was our take on ChartMogul. If you have used ChartMogul, Putler or any other business software, we would love to hear about your experience. Let us know in the comments section below.
How does Putler compare with other analyitcal tools?
| Features | Putler | ChartMogul | Baremetrics | Metorik |
|---|---|---|---|---|
| SaaS Metrics | Yes | Yes | Yes | Yes |
| Non SaaS Metrics | Yes | Yes | No | Yes |
| Website metrics | Yes | No | No | Yes |
| Number of Integrations | 17 | 7 | 4 | 4 |
| Integrates with PayPal | Yes | Yes | No | Yes |
| Team sharing available | Yes | No | No | No |
| Realtime updates | Yes | Yes | No | Yes |
| Multi-currency support | Yes | Yes | No | Yes |
| Aggregated reports | Yes | No | No | No |
| Individual reports | Yes | No | No | Yes |
| Customer Segmentation (RFM) | Yes | No | No | No |
| Send money functionality | Yes | No | No | No |
| Subscription Management | Yes | No | No | No |
| Process refunds | Yes | No | No | No |
| Desktop App | Yes | No | No | No |
| Chrome extension | yes | No | No | No |
| Intuitive Search | Yes | No | No | No |
| Pricing | $29 | $100 | $50 | $50 |