
You open WooCommerce, check your reports, and see revenue is up. Orders are coming in. Things look fine.
But here’s what your dashboard isn’t telling you. You have no idea if those orders are actually profitable after product costs, shipping, and ad spend.
You don’t know which customers are worth winning back and which ones bought once and vanished. You can’t see which marketing channel is driving real revenue versus just traffic. And you have no way to predict whether next month will look better or worse than this one.
WooCommerce report limitations aren’t obvious at first. The dashboard looks complete. It has numbers, charts, and filters. But the further you dig, the more you realize it was built to show you what happened inside your store, not to help you run a growing business.
This article covers every significant gap in WooCommerce’s native reporting, what each one costs you, and the most practical ways to fix it without needing a developer or a data team.
What WooCommerce reports actually give you
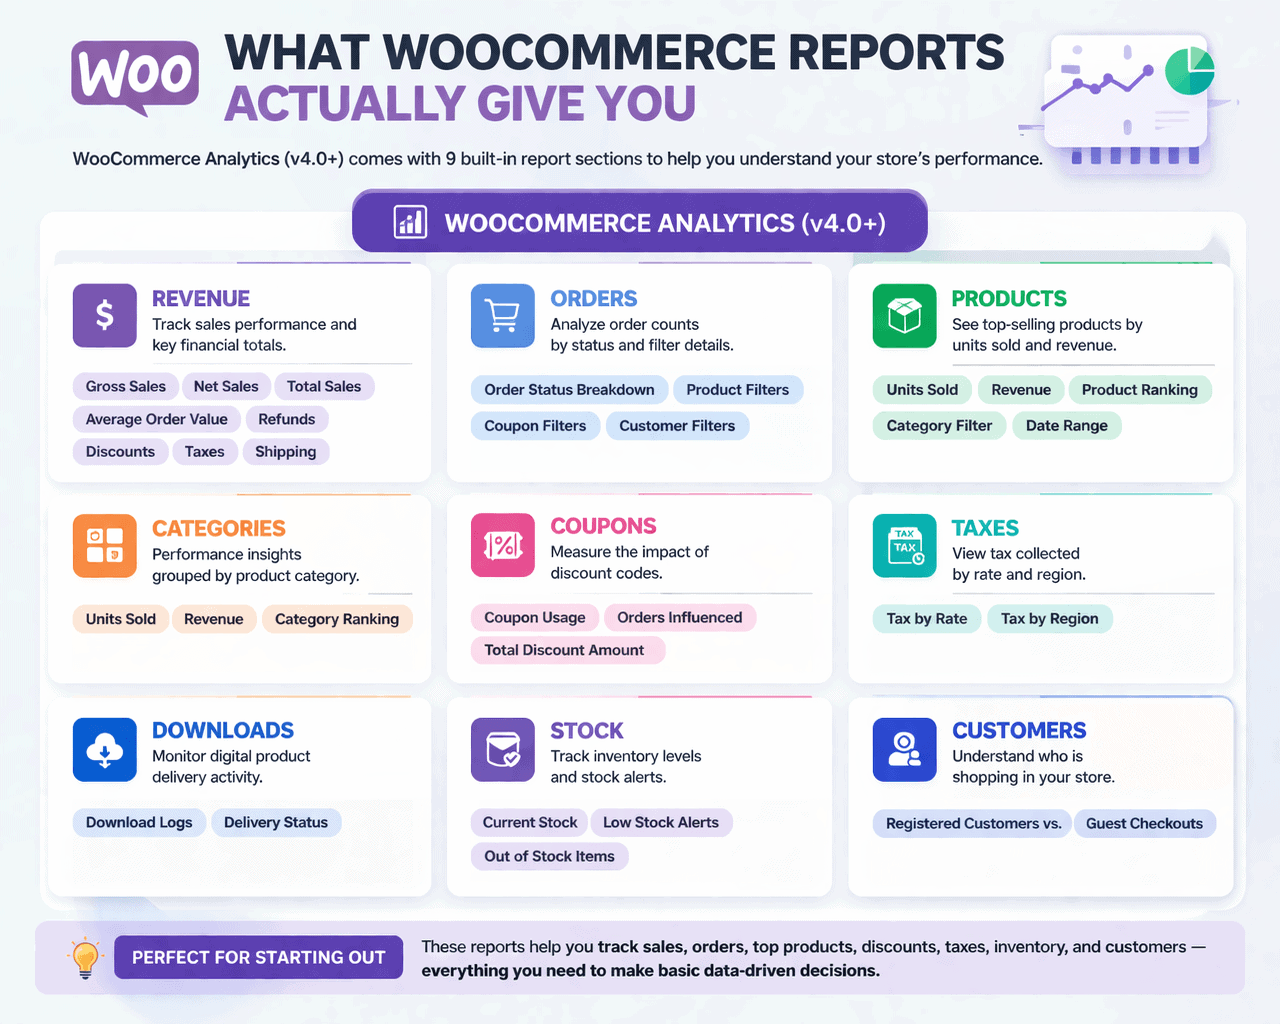
WooCommerce replaced its old reporting system with WooCommerce Analytics in version 4.0, and the upgrade was genuinely useful. Today, the platform includes nine built-in report sections:
- Revenue: Gross sales, net sales, total sales, average order value, refunds, discounts, taxes, and shipping over any date range with period comparisons.
- Orders: Order counts broken down by status, with filters for product, coupon, and customer.
- Products: Units sold and revenue ranked by individual product, filterable by category and date.
- Categories: Same as products but grouped by category.
- Coupons: Discount usage, orders influenced, and total discount amounts by coupon code.
- Taxes: Taxes collected broken down by rate and region.
- Downloads: Delivery logs for digital products.
- Stock: Current inventory levels, low stock alerts, and out-of-stock items.
- Customers: Basic split between registered customers and guest checkouts.
For a store just starting out, this is enough to make basic decisions. You can see what’s selling, track refunds, monitor discount usage, and check inventory. That’s genuinely useful.
The problem is that this is where the usefulness stops. The moment you start asking harder questions, WooCommerce has nothing to offer.
WooCommerce report limitations that hurt growing stores
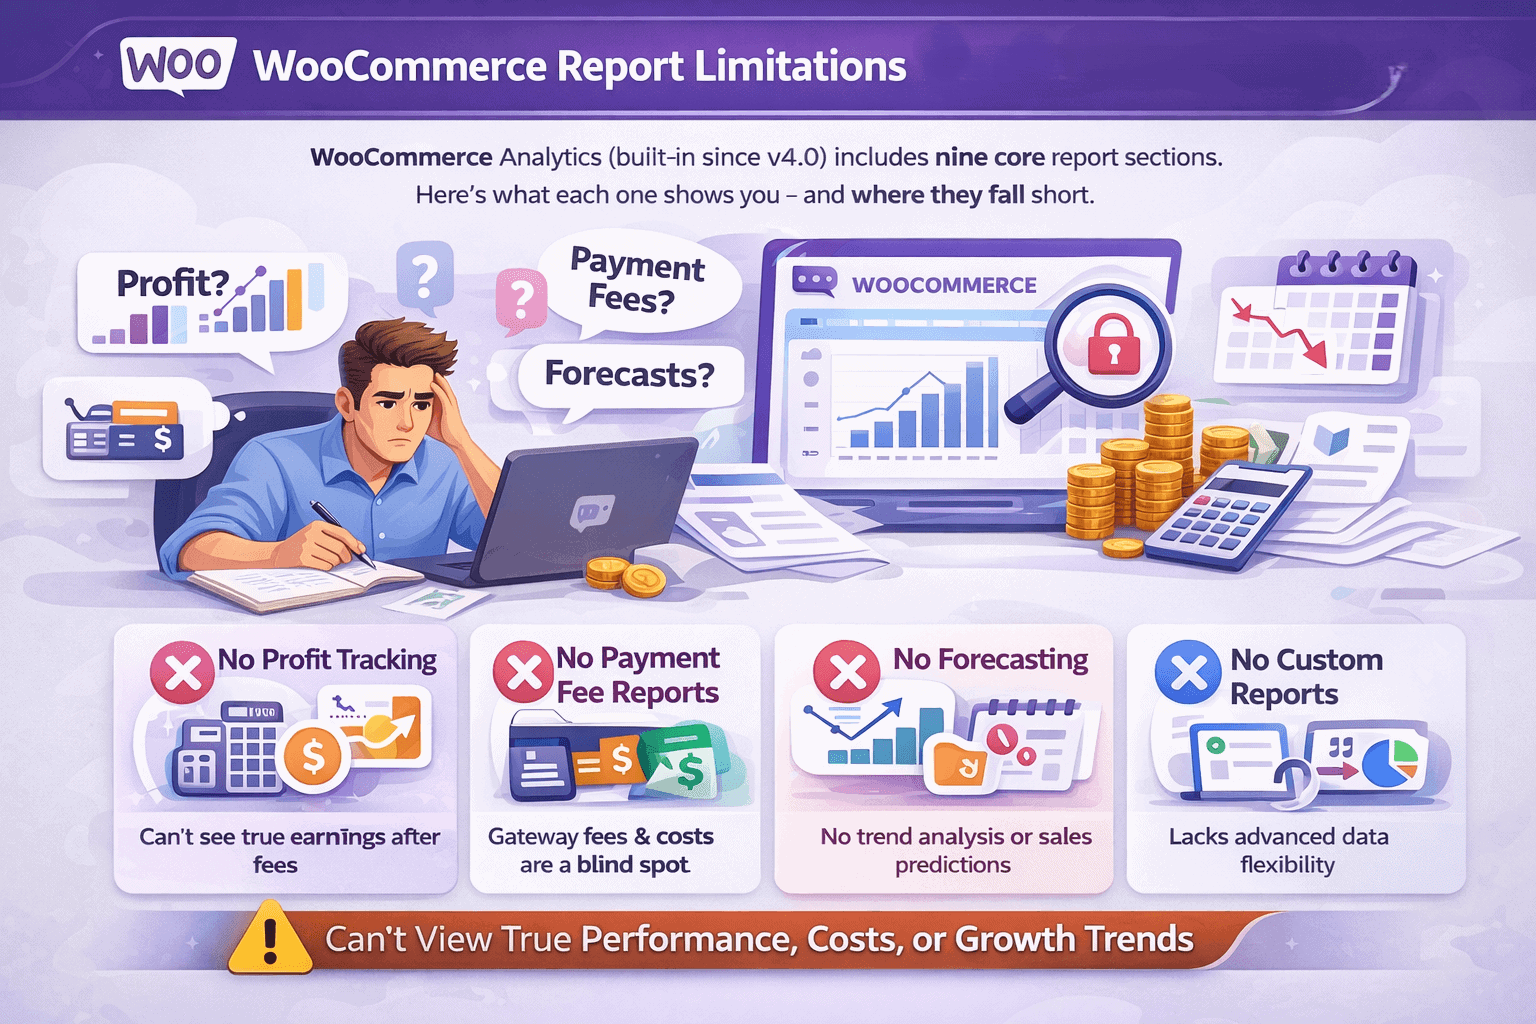
No profit or margin reporting
WooCommerce tells you how much revenue came in. It has no idea how much of it you actually kept. There is no native profit report. No margin breakdown by product.
No way to see whether your bestselling product is making you money or quietly losing it after costs. WooCommerce added a Cost of Goods Sold field in version 10.3 in late 2025, but the WooCommerce team has confirmed that profit reports and analytics are still on the roadmap.
The data field exists but generates no usable report. For now, calculating profit requires exporting orders to a spreadsheet and doing the math manually.
No customer lifetime value
WooCommerce shows you new versus returning customers. That’s it.
There is no customer lifetime value calculation, no way to identify your highest value buyers, and no scoring system to prioritize who to target with retention campaigns.
For a store where repeat customers are the difference between growth and stagnation, this is a critical blind spot.
No marketing attribution worth trusting
WooCommerce recently added an Order Attribution feature, but it comes with significant limitations that make it unreliable for real marketing decisions.
It uses last-touch attribution only, meaning the final click before purchase gets all the credit. It does not connect ad spend to revenue in any way.
Safari limits its tracking cookies to seven days. And it cannot show you which channels deliver high-value customers versus one-time buyers. You cannot calculate ROAS, cost per acquisition, or true channel ROI from inside WooCommerce.
No forecasting or predictive analytics
WooCommerce reports are entirely backward-looking. You can see what happened last month. You cannot see what is likely to happen next month.
There is no revenue forecasting, no stock demand prediction, no seasonal trend modeling, and no scenario planning. For stores managing inventory and planning ad campaigns, flying without a forecast is an expensive way to operate.
No cross-channel reporting
WooCommerce only sees WooCommerce. If you also sell on Etsy, Amazon, or eBay, or if you run multiple WooCommerce stores, each one lives in its own silo.
There is no native way to get a consolidated view of your total business performance across channels. Every comparison requires manual exports and spreadsheet reconciliation.
Subscription reporting is broken
If you sell subscriptions, WooCommerce’s native reporting is genuinely inadequate. There are no MRR, ARR, or churn metrics in the core platform.
Subscription analytics require a paid extension on top of the WooCommerce Subscriptions plugin, which itself costs $279 per year.
That extension carries a weak 3.4 out of 5 rating on the WooCommerce marketplace, with store owners consistently reporting missing or inaccurate renewal data.
No real-time data
As of WooCommerce 10.5, the default analytics processing mode runs every 12 hours. Your dashboard could be showing you data that is half a day old.
An immediate processing option exists, but it can degrade performance in busy stores. During a flash sale or product launch, when you most need live data, WooCommerce is the last place to look.
No funnel or conversion path analysis
WooCommerce tracks what happens inside your store after someone arrives. It cannot show you what happened before.
There is no checkout funnel visualization, no drop-off analysis by step, and no way to see which landing pages convert best. You know your overall conversion rate. You cannot diagnose why it is what it is.
No cohort or retention reporting
There is no way to group customers by the period they first bought, the product they started with, or the channel that acquired them, and then track how their behavior evolves over time.
Cohort analysis is one of the most powerful tools for understanding whether your store is getting better or worse at retaining customers. WooCommerce offers none of it.
Export limitations that slow everything down
WooCommerce exports are CSV only. No Excel, no PDF. Custom columns require a plugin or a developer. Large exports run in the background and get emailed to you rather than downloading immediately.
For stores doing serious analysis, these constraints add friction to every reporting workflow.
Stock reports you can’t export
The Stock report is the one report in WooCommerce Analytics that cannot be exported at all. If you need inventory data in a spreadsheet, you have to use the legacy Products screen, which has its own limitations.
For stores managing large catalogues, this is a frustrating gap with no clean native workaround.
Customer data is barely there
The Customers report in WooCommerce shows registration counts and a basic new versus returning split.
There is no segmentation by purchase behavior, no geographic breakdown beyond what you can filter manually, and no way to identify at-risk customers before they churn.
For a platform used by millions of stores, the customer intelligence on offer is remarkably thin.
The reporting gap gets expensive fast

These limitations might feel abstract until you put a number on them.
Store owners who fill the gaps manually through CSV exports, spreadsheet formulas, and cross-referencing multiple platforms typically spend 5 to 10 hours per week on reporting tasks.
At a conservative valuation of $50 per hour for an owner’s time, that’s $1,000 to $2,000 every month spent assembling information that a proper analytics tool would surface automatically.
The cost of missing profit visibility is harder to quantify but potentially much larger. Scaling a product category without knowing its margin means you could be investing in ads, inventory, and fulfillment for products that lose money at volume.
And without marketing attribution, every ad budget decision is a guess. Merchants routinely over-invest in channels that look productive based on last-touch data and under-invest in channels doing the real heavy lifting earlier in the customer journey.
Workarounds that help within WooCommerce
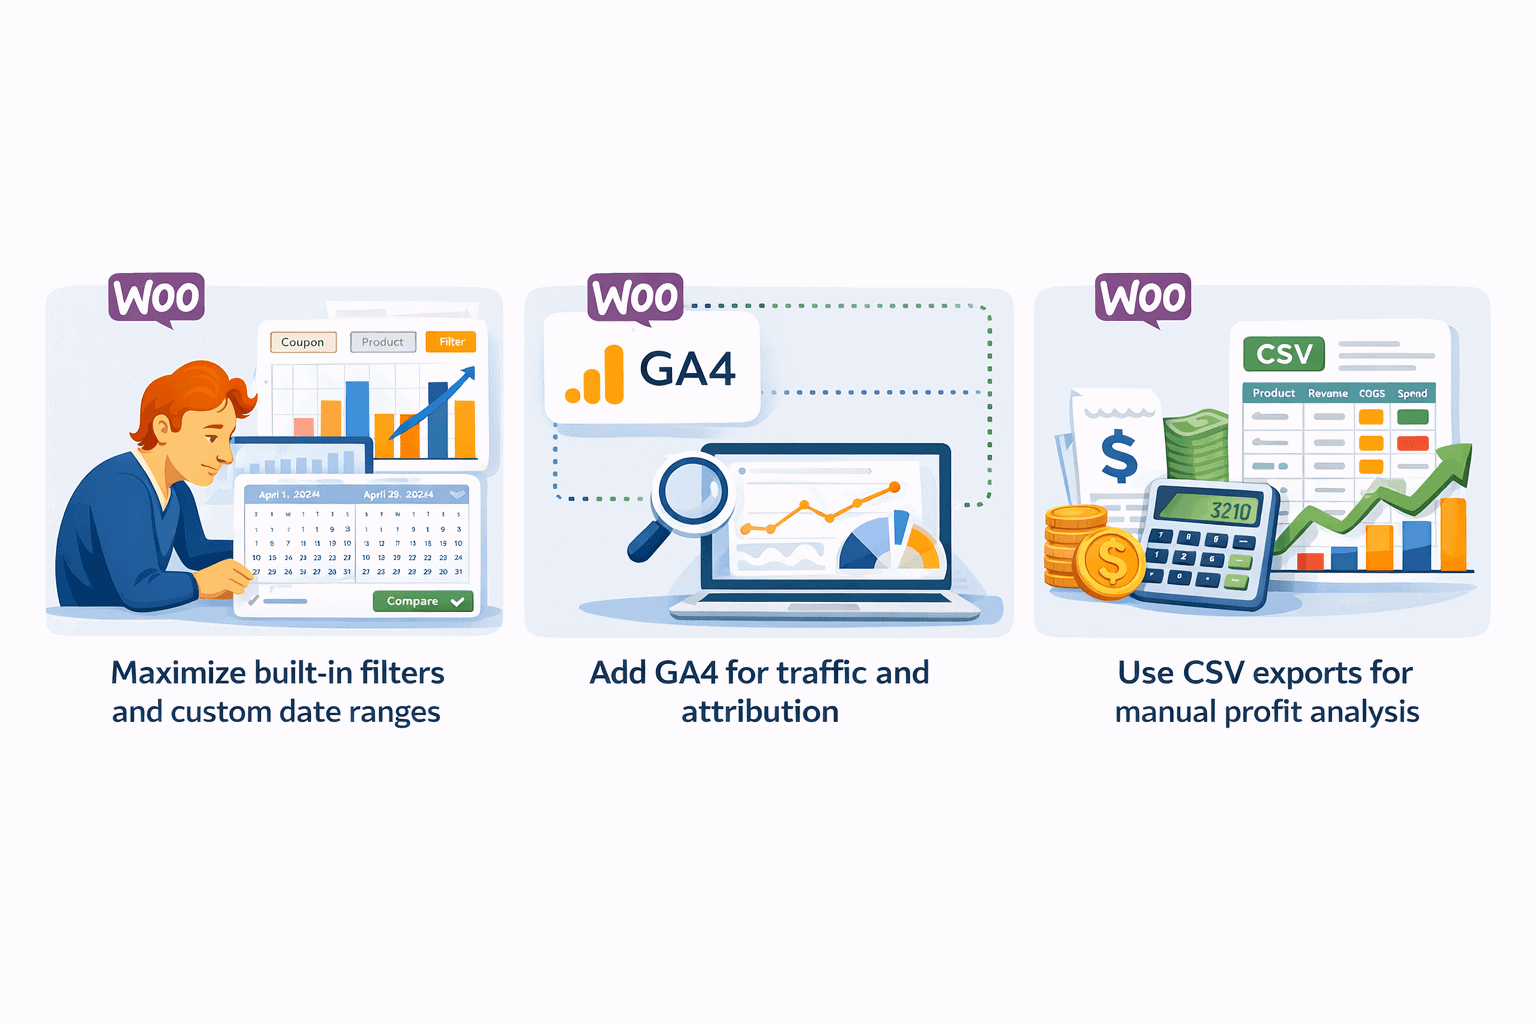
Before reaching for a paid tool, there are free steps worth taking inside WooCommerce itself.
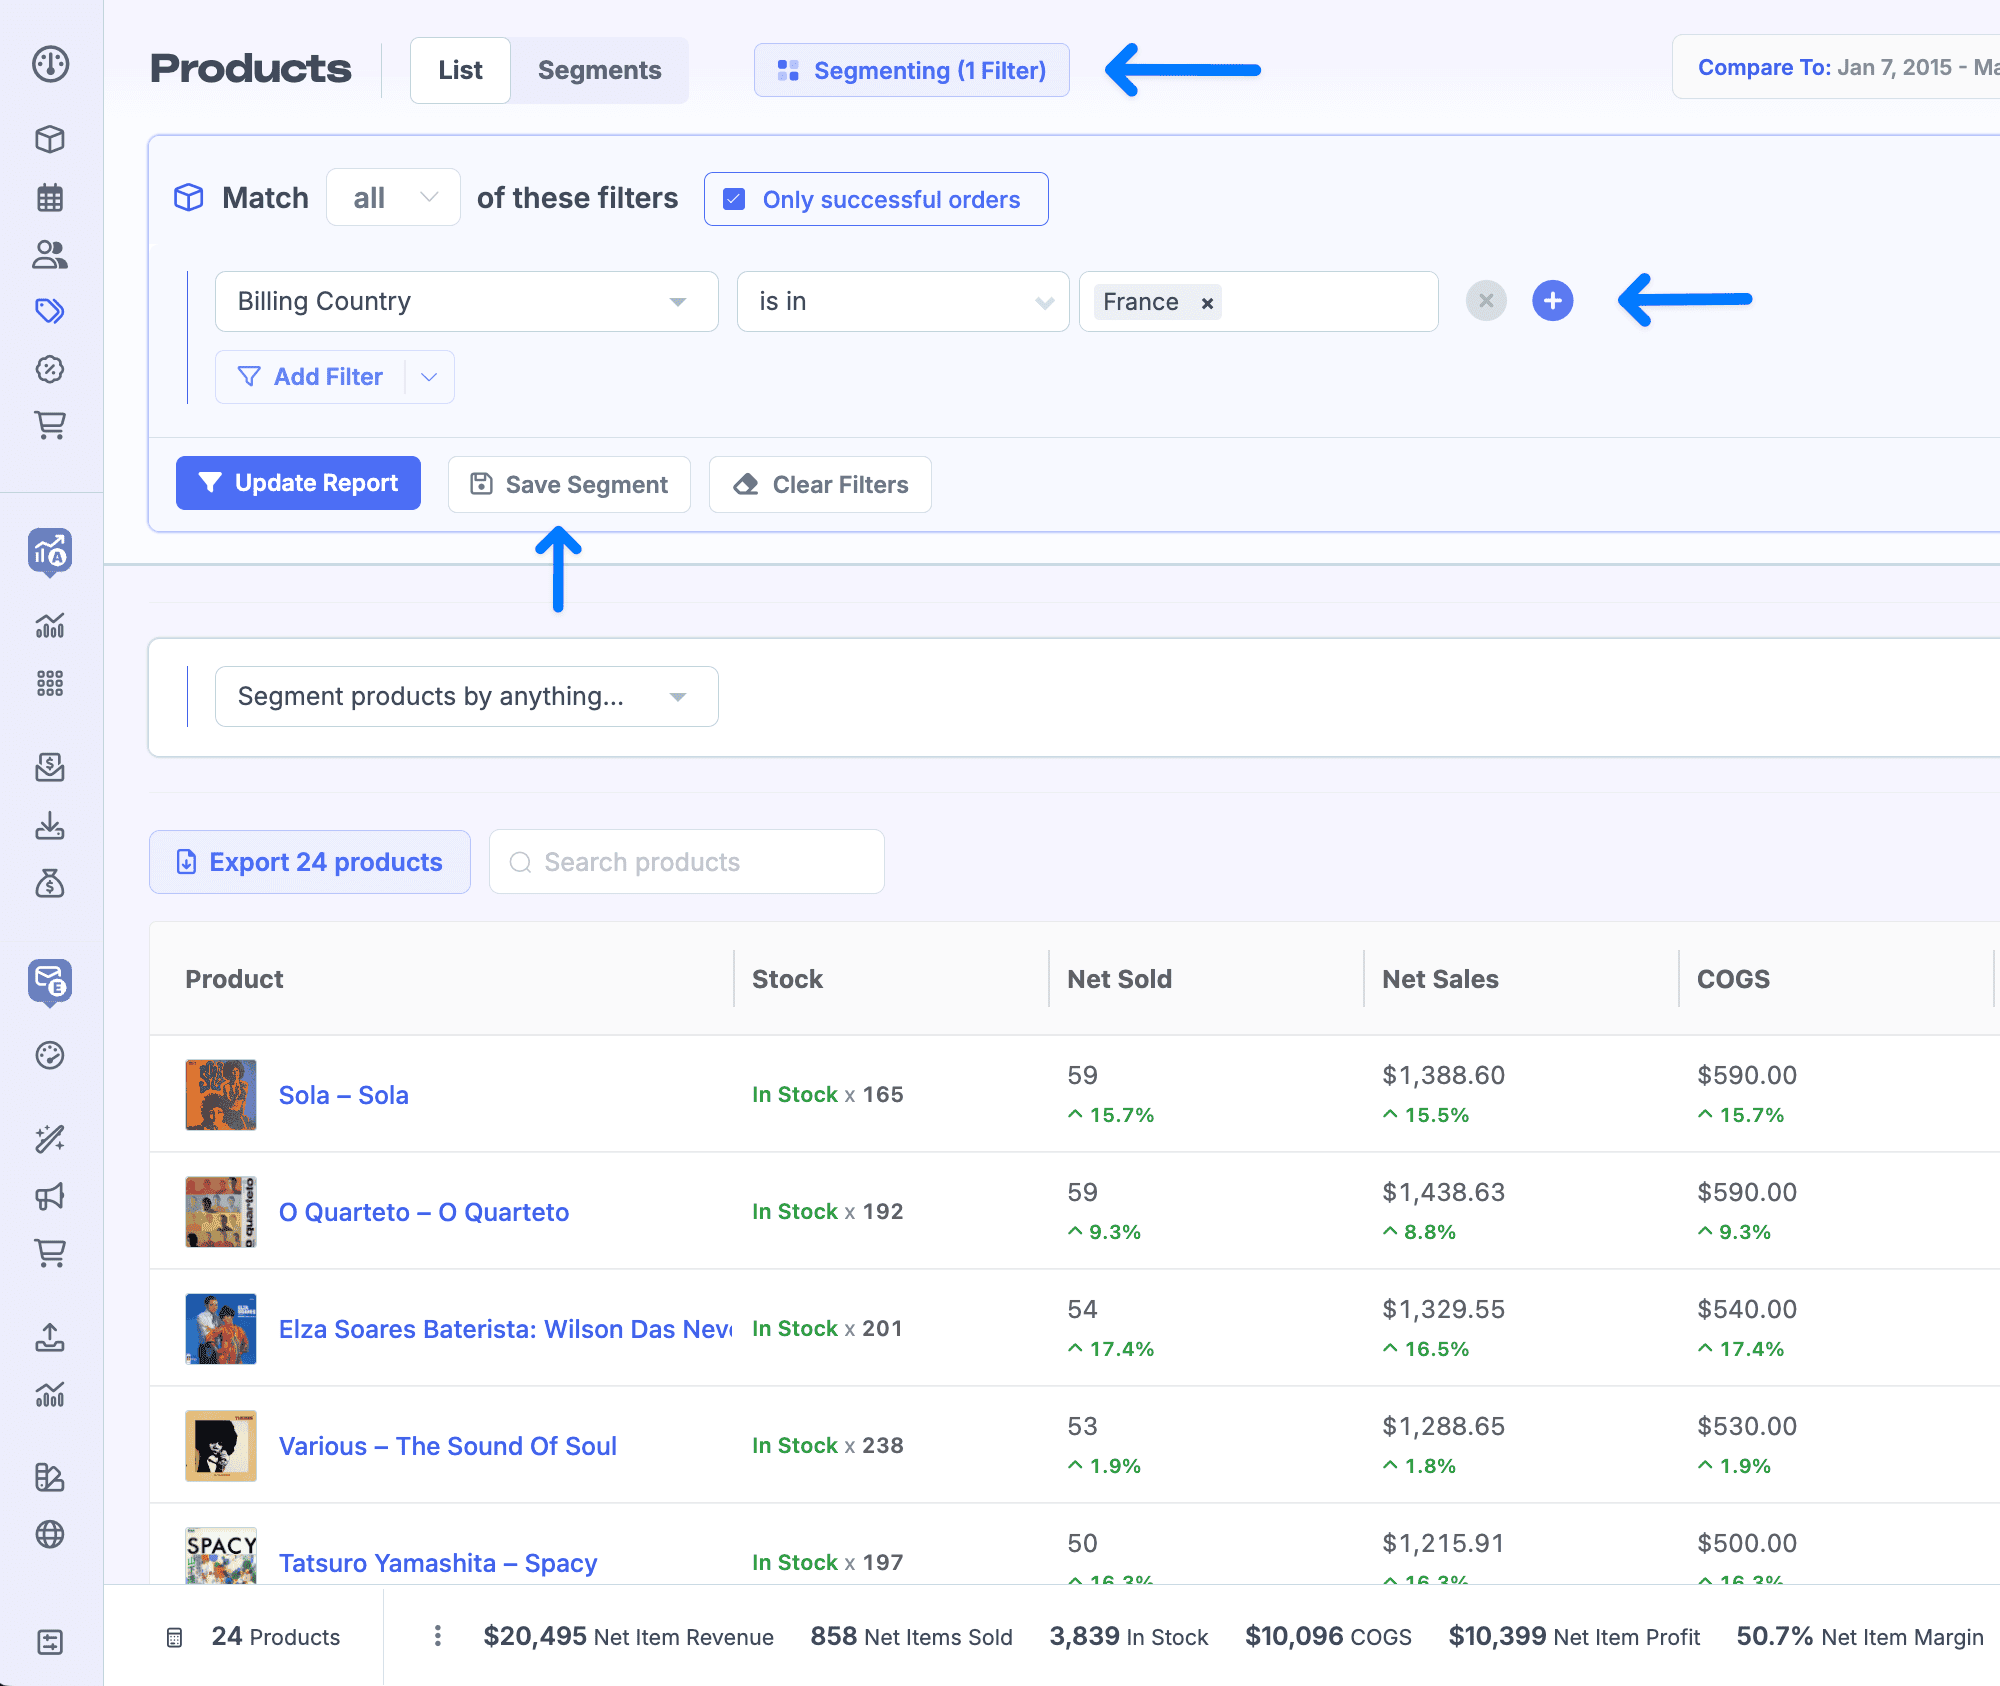
Maximise built-in filters and custom date ranges: WooCommerce Analytics allows you to stack multiple filters simultaneously.
You can combine coupon codes with product categories, compare any two date periods side by side, and sort every table by any column. Most store owners use a fraction of this flexibility. Spend 30 minutes exploring the filter options before assuming a report doesn’t exist.
Add GA4 for traffic and attribution: Google Analytics 4 is free and fills WooCommerce’s biggest visibility gap: what happens before someone lands on your store. GA4 shows traffic sources, checkout funnel drop-off by step, cross-device behavior, and audience demographics.
Connect it through the free Google Analytics for WooCommerce plugin. Just keep in mind that GA4 typically shows 15 to 40% fewer conversions than WooCommerce due to ad blockers and cookie consent limitations, so use it for directional marketing intelligence rather than financial reporting.
Use CSV exports for manual profit analysis: Export your monthly orders from WooCommerce, add a COGS column for each product, and pull your actual ad spend from Google Ads and Meta.
A basic spreadsheet formula gives you gross profit per order and true marketing ROI per channel. It is time-consuming, but it works, and it is the only free way to get profit visibility until you adopt a dedicated tool.
Tools that fill the WooCommerce reporting gaps
Free workarounds get you part of the way there. But if you want the full picture without spending hours every week assembling it manually, you need a dedicated tool.
GA4
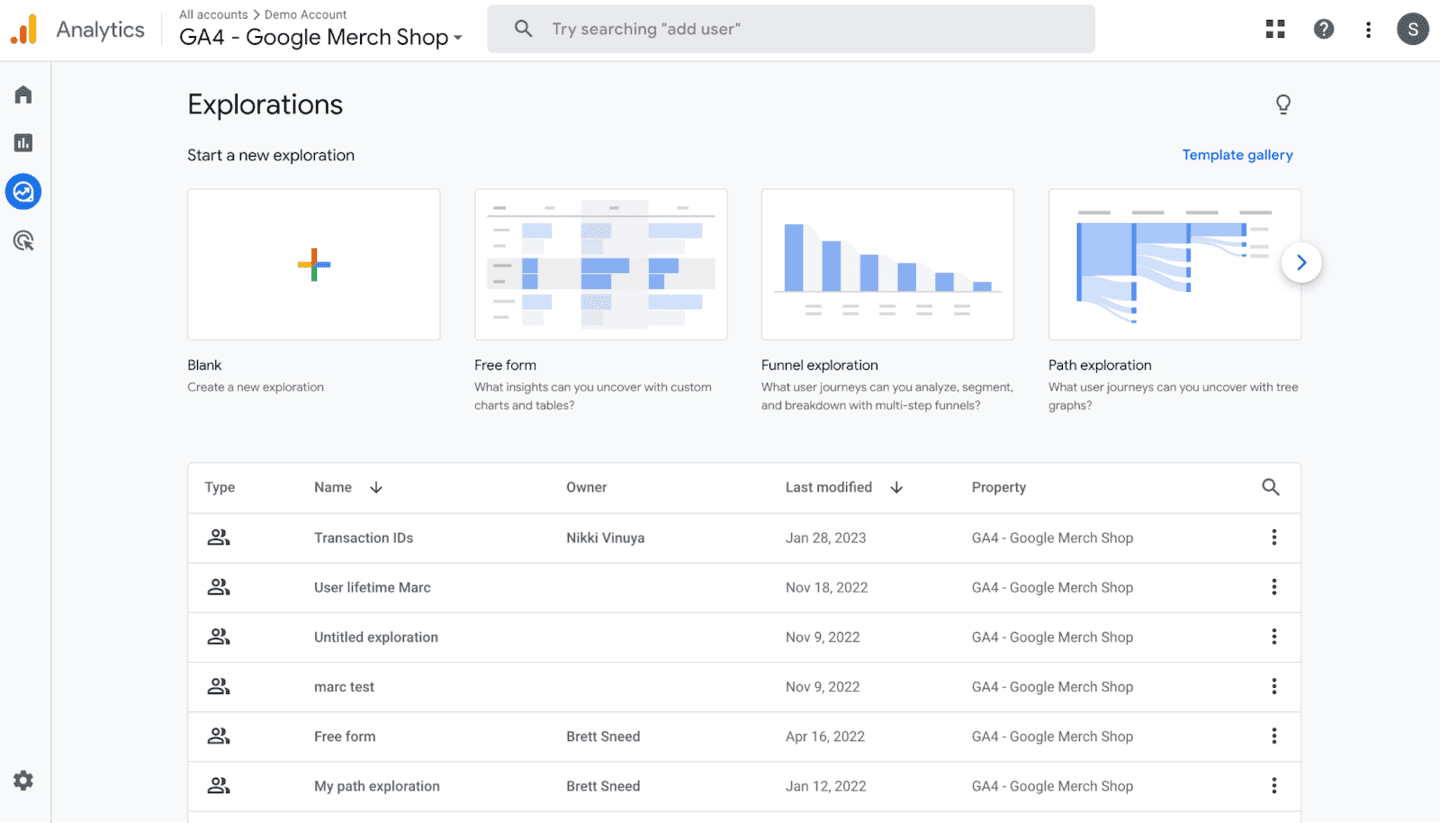
Already covered above. Free, essential for traffic and pre-purchase behavior, but not a replacement for store-level analytics. Use it alongside WooCommerce, not instead of it.
Metorik
A WooCommerce-specific analytics platform starting at $25 per month. Its standout strength is profit reporting.
It integrates directly with Meta, Google, TikTok, Pinterest, and Microsoft Ads to calculate true ROAS, tracks COGS alongside operational expenses, and includes subscription cohort reporting with MRR, churn, and LTV. It also has built-in email automation with abandoned cart recovery.
The limitation is scope, Metorik only supports WooCommerce and Shopify. It does not consolidate data from payment gateways, Etsy, Amazon, or other selling channels.
Putler
If WooCommerce’s fragmented data is the core problem, Putler is the core fix.
Most WooCommerce reporting gaps exist because your store data and your payment gateway data live in separate systems that never fully agree. Putler connects to both independently.
It pulls from WooCommerce and from Stripe, PayPal, and other gateways as separate sources, then automatically deduplicates, cleans, and consolidates everything into one accurate revenue number.
Gateway fees accounted for. Refunds captured. Currencies converted using actual daily rates. One clean picture your WooCommerce dashboard was never going to give you.
On top of that clean data foundation, Putler adds what WooCommerce reports cannot:
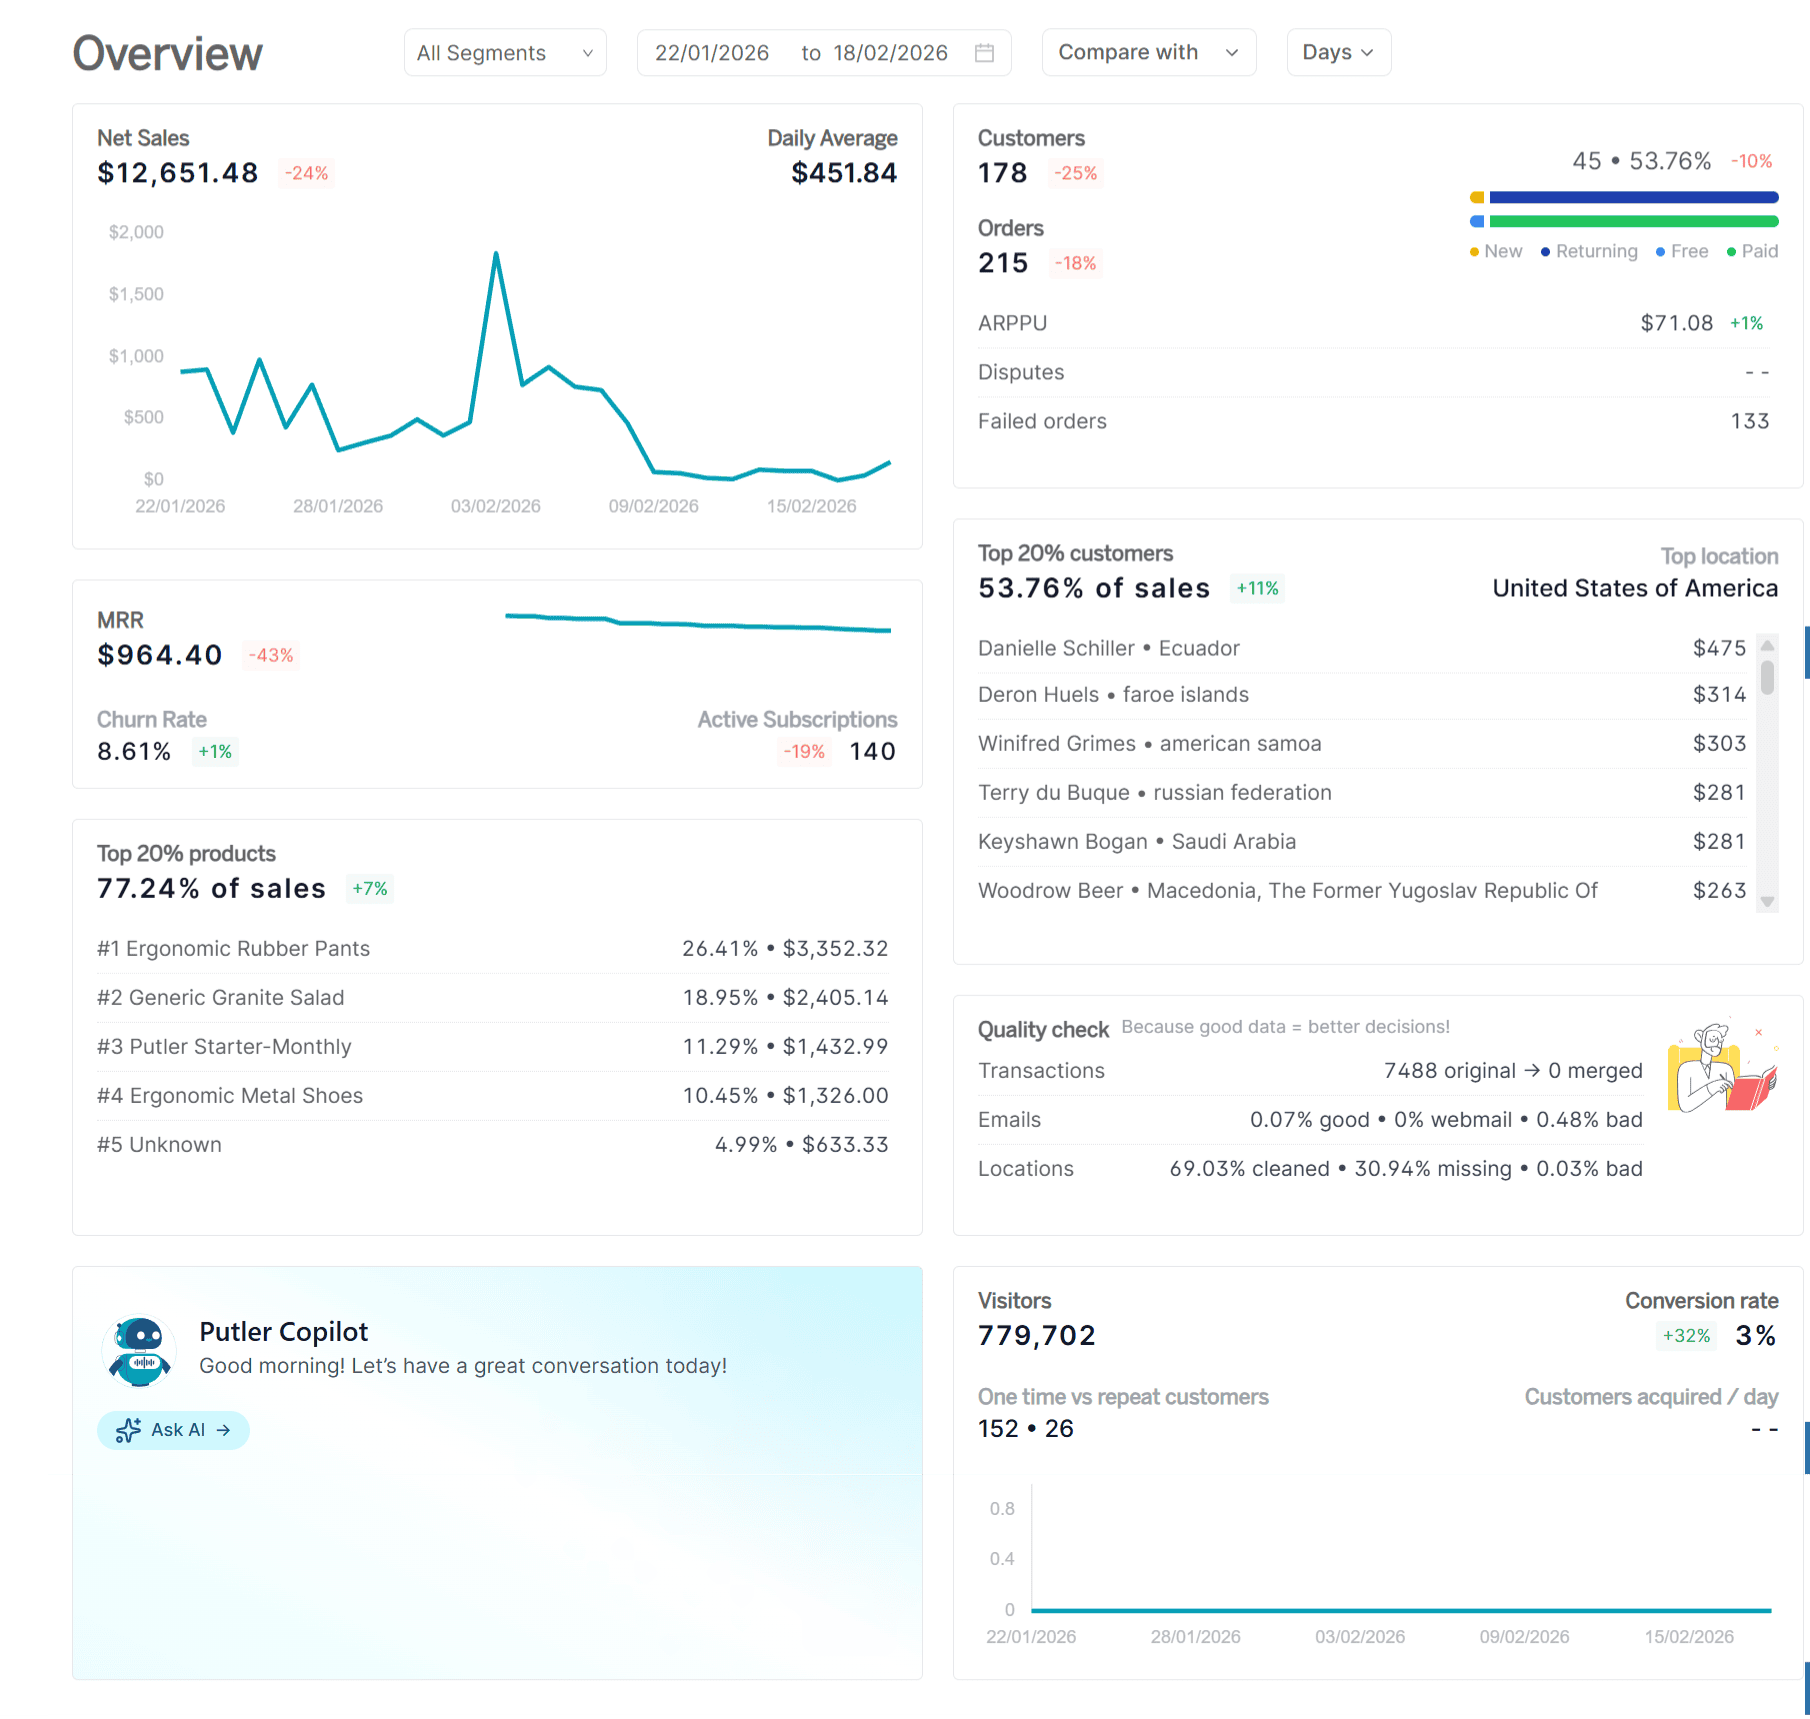
Customer intelligence: Unified profiles with full purchase history and automatic RFM segmentation across 11 groups. You know who your best customers are, who is slipping away, and who to target next.
Sales patterns: The sales heatmap shows your actual peak buying hours and days. Stop scheduling campaigns on instinct.
Real product performance: Product analysis across all your channels combined, plus frequently bought together data for cross-sell campaigns.
Full transaction visibility: Every sale, refund, and dispute from every payment processor in one feed. Process refunds directly from Putler without touching your gateway.
Traffic to revenue: Web analytics that connects your GA data to actual purchases so you stop optimizing for visits and start optimizing for sales.
For any store tired of reconciling WooCommerce against Stripe against PayPal in a spreadsheet every Monday morning, it solves the problem at the source.
WooCommerce reports are a starting point, not a finish line
WooCommerce’s built-in reporting is a solid foundation for a new store. Nine report sections, custom date ranges, period comparisons, and basic filters give you enough to make early decisions.
But the WooCommerce report limitations become real the moment you start spending on ads, managing inventory seriously, or trying to understand which customers are actually worth keeping.
The path forward is straightforward. Start by extracting more from WooCommerce’s existing filters and add GA4 for traffic intelligence.
When manual reconciliation starts eating too much time, move to a dedicated tool. Metorik if profit tracking and WooCommerce depth is the priority. Putler if you sell across multiple channels and need one clean consolidated view of your entire business.
- Managing Multiple WooCommerce Stores: The Definitive Guide
- Best WooCommerce Reporting Plugins of 2024
- WooCommerce Reports: A Detailed Guide
- WooCommerce Analytics: Complete Guide To Successful WooCommerce Reporting
- WooCommerce export: How to export orders, customers, and everything else from WooCommerce