In a digital marketplace where 20% of small businesses fail within their first year and 50% shut down within five, one factor consistently separates the survivors from the rest: smarter decision-making.
A McKinsey Global Institute study found that data-driven businesses are 23 times more likely to acquire customers, six times as likely to retain them, and 19 times more likely to be profitable.
Yet surprisingly, only 24% of small businesses consider themselves “data-driven” according to a recent Salesforce survey.
I recently spoke to a founder who’d spent months running ads with no idea what was working — or why sales kept flatlining.
Solution: Data analytics for small businesses.
In this article, let’s discuss what goes wrong, burst some myths, and find a simple solution to all analytics for small business problems.
What is data analytics (and how does analytics for small business help)?
Out of the many definitions of data analytics, I found IBM’s to be the most precise and relevant.
Data analytics is the use of advanced analytic techniques against very large, diverse data sets that include structured, semi-structured, and unstructured data, from different sources, and in different sizes. It enables businesses to uncover hidden patterns, unknown correlations, and other useful insights.
— IBM
In simple terms:
Data analytics helps businesses analyze large and mixed types of data to find useful trends, patterns, or insights. This helps them make smarter decisions and improve performance.
For small eCommerce businesses, analytics isn’t about crunching massive datasets – it’s about answering practical questions like:
- Which products are making you the most profit (not just revenue)?
- Where are your best customers coming from?
- Which marketing efforts are actually paying off?
- Why do some customers buy once and disappear while others keep coming back?
Want a deeper dive into how to actually track your eCommerce business? Check out eCommerce Analytics 101 – it answers all your questions and gives you a solid foundation to get started.
Big data vs. Usable data
Data is the new oil, and analytics is the combustion engine.
– Peter Sondergaard, Gartner Research
You’ve probably heard the term “big data” thrown around, but here’s the truth: most small businesses don’t need big data – they need useful data.
Big data is about volume, useful data is about value, and that’s what small businesses really need.
Here’s what happened when I first explored data analytics for small business .
My first encounter with business analytics:
When I first started tracking analytics, I went overboard. Every dashboard, every metric — I tracked it. After months of building fancy reports, I realized my sales hadn’t moved an inch. I was overwhelmed with data, not insight.
The turning point:
A senior asked me, “What are the 10–15 numbers that drive your decisions?” I couldn’t answer. That day, I learned: data isn’t about tracking everything. It’s about focusing on what matters.”
Key metrics and data types to track
These are key metrics I used to focus on while working with business analytics for small business.
| Category | Metric | What it shows |
|---|---|---|
| Website & traffic | Pageviews | Total pages viewed |
| Unique visitors | Count of individual users | |
| Bounce rate | % who left after one page | |
| Avg. session duration | Time spent per visit | |
| Traffic sources | Where visitors came from | |
| Sales & products | Units sold | Total products sold |
| Gross revenue | Sales before returns/discounts | |
| Net revenue | Sales after returns/discounts | |
| Avg. order value (AOV) | Avg. spend per order | |
| Refund rate | % of refunded orders | |
| Customer insights | Customer lifetime value | Total value per customer |
| Purchase frequency | How often people buy | |
| RFM score | Recency, frequency, and spend level | |
| Churn rate | % of customers lost | |
| Retention rate | % of customers kept | |
| Marketing performance | CAC | Cost to get a new customer |
| ROAS | Revenue per $1 spent on ads | |
| Email open/click rate | Email engagement | |
| Social engagement rate | Likes, comments, shares | |
| Campaign conversion rate | % of leads who convert | |
| Financial metrics | MRR | Monthly recurring revenue |
| ARR | Yearly recurring revenue | |
| Gross profit margin | Profit after product costs | |
| Operating expenses | Business running costs | |
| Net profit | Final earnings after all costs |
Now, let’s discuss the challenges small businesses face with analytics and the solutions to overcome them.
Data challenges for small businesses
Here are common data challenges when it comes to analytics for small business.
Data collection challenges
1. Fragmented data sources: Your data’s scattered—Amazon holds one piece, Shopify another, PayPal a third, and your website the rest. It’s like trying to complete a puzzle when half the pieces are in different rooms.
2. Uncertainty about what data matters: You’re looking at a flood of numbers and dashboards. But the big question is: what actually drives growth?
3. Inconsistent data formats: Shopify shows your sales one way, Amazon shows them another. Comparing them feels like translating two different languages.
4. Data accuracy concerns: One tool says 500 visitors. Another says 650. You’re constantly cross-checking and still unsure what’s real.
5. Data duplication issues: A single customer buys from two places, but your system counts them twice. That inflates your customer count and messes up your metrics.
Tools and technology challenges
6. High cost of data tools: Enterprise-level tools are powerful, but way out of your budget. And honestly, you don’t need half the features.
7. Data privacy compliance: GDPR, CCPA… just reading the acronyms is stressful. You want to do it right, but you don’t have a legal department.
8. Complexity of tools: You log into your analytics and feel instantly overwhelmed. The reports look like they need a data science degree to understand.
9. Inaccurate forecasting: You’re making inventory and staffing decisions based on guesswork. And those guesses often miss.
10. Real-time data access: You’re reading reports days after things happen. But by then, the moment to act has passed.
Customer segmentation challenges
You know all customers aren’t equal, but identifying your VIPs from one-time buyers feels like trying to find specific faces in a crowded stadium.
Human resource challenges
11. Limited resources: You’re already the CEO, marketer, and customer service rep. Analyzing data? That’s just not realistic.
12. Lack of data strategy: You’re collecting data because you know it’s important. But it’s just sitting there. No plan. No action.
13. Budget constraints: You want to invest in analytics, but inventory or ad spend always take priority.
Now let’s start with free tools and see which tool can solve your problems and can do more.
Free (and freemium) tools for small business analytics
Get the most out of data analytics for small business by focusing on the metrics that truly move the needle for your customers.
Google Analytics
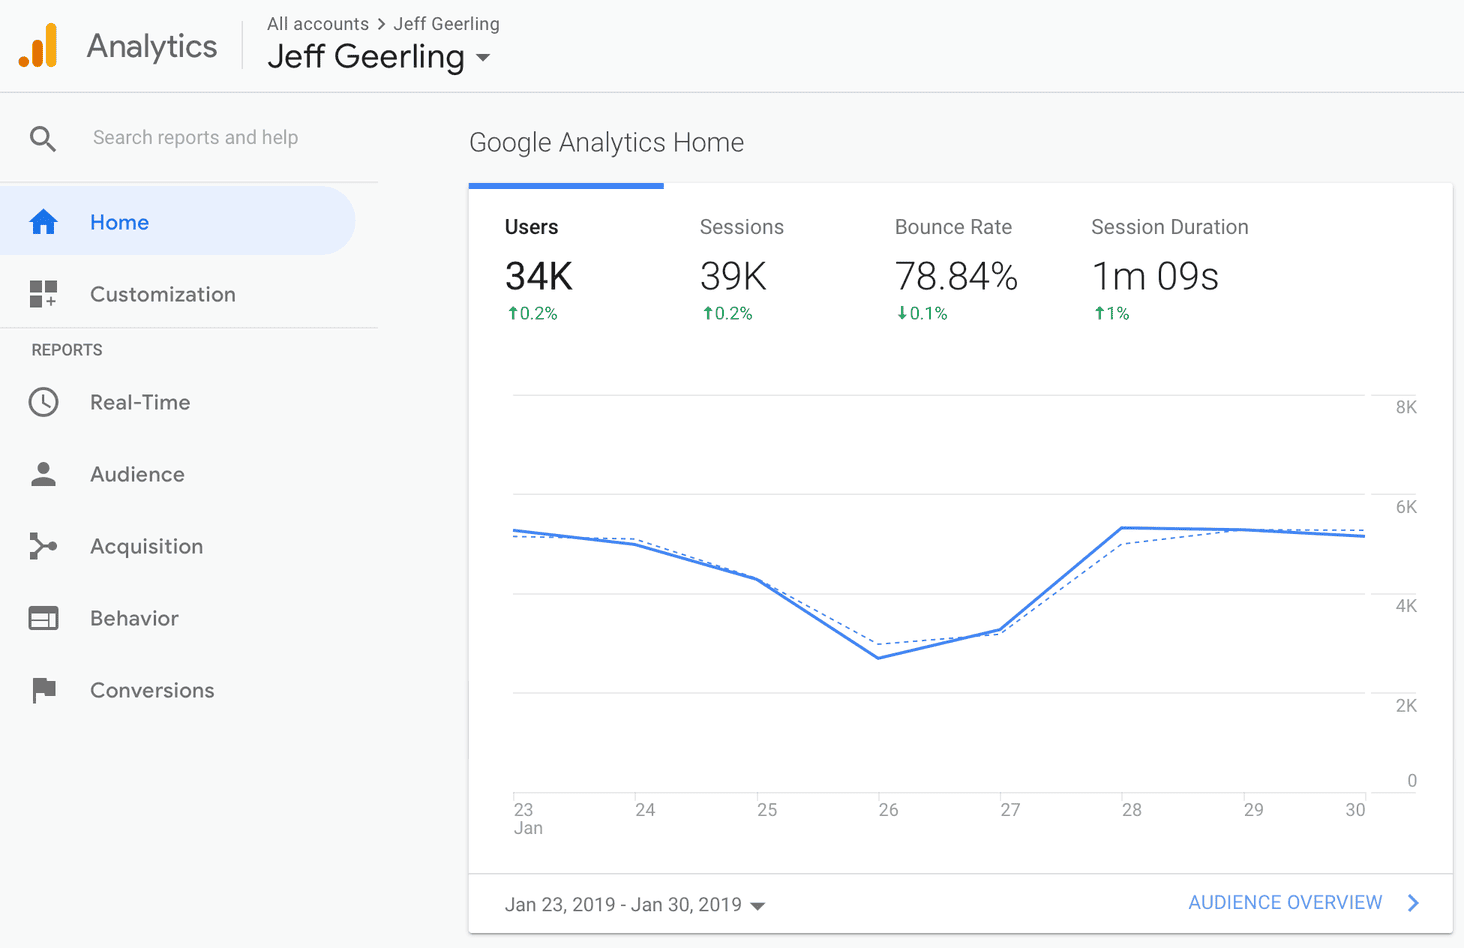
I started with Google Analytics, it’s free, gives you basic website traffic insights, and works well as a starting point for data analysis for small business.
But as your business grows beyond a simple website, its limitations become painfully apparent.
You need to jump to Google Analytics 360 at $150,000 a year, which creates a frustrating middle ground where you need more but can’t justify enterprise costs.
Features:
- Comprehensive website traffic analysis
- Customizable dashboards and reports
- Integration with other Google services (e.g., Google Ads, Search Console)
- Real-time data tracking
- User demographics and behavior insights
Pros:
- Tracks website and marketing data thoroughly
- Free to use and widely supported
- Offers customizable dashboards and reports
- Good at showing traffic sources, behavior, and conversions
- Built-in goal tracking and funnel visualization
Cons:
- The steep learning curve for beginners
- Limited data retention for free users (14 months)
- Privacy concerns due to data sharing with Google
- Sampling issues with large datasets
- Doesn’t connect directly to Shopify, Amazon, PayPal, etc.
- Requires setup to focus on meaningful business KPIs
Who is it for: Great for bloggers, startups, and small websites wanting free insights into website traffic and user behavior. It’s a good entry-level tool, but lacks depth for multi-channel or ecommerce businesses.
Matomo
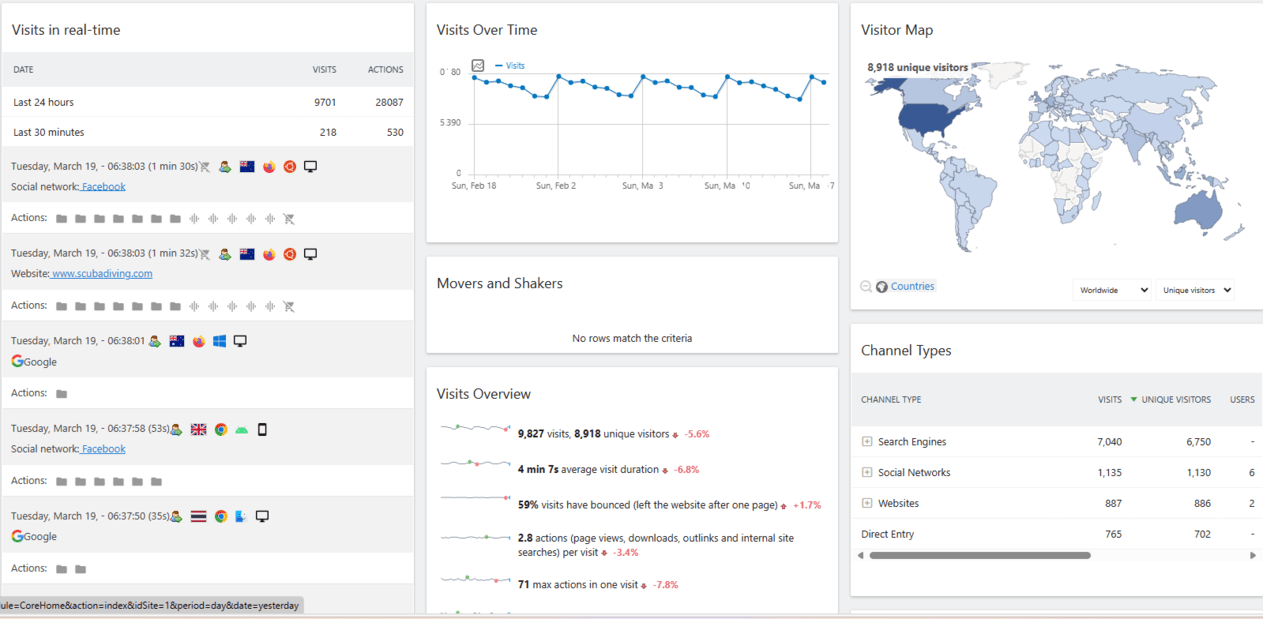
After trying Google analytics, I explored Matomo (formerly Piwik) as an open-source alternative that gives you full data ownership without the privacy concerns.
While it offers more control and no sampling limitations, the self-hosted version requires technical know-how to maintain, and the cloud version starts getting expensive as you scale.
Beyond basic tracking needs—something to consider when exploring data analytics services for small business.
Features:
- Full data ownership and GDPR compliance
- No data sampling
- Customizable tracking and reporting
- Heatmaps and session recordings (limited)
- Integration with popular CMS platforms (e.g., WordPress)
- Self-hosted option gives full data ownership and privacy
Pros:
- GDPR and privacy compliance built-in
- Supports real-time data tracking
- Customizable dashboards and clean UI
- Identity resolution features available in paid plans
- Open-source and highly extensible
- Easier to standardize data across plugins compared to GA
Cons:
- Not natively integrated with platforms like Shopify, Amazon, PayPal
- Free version lacks some advanced features
- Setup can be technical if self-hosted
- Limited customer segmentation features in the free plan
- Data visualization not as advanced or beginner-friendly as some paid tools
Who is it for: Ideal for privacy-conscious businesses and agencies that want full control over their data. Best suited for teams with some technical skill or budget for the cloud version.
Open Web Analytics (OWA)
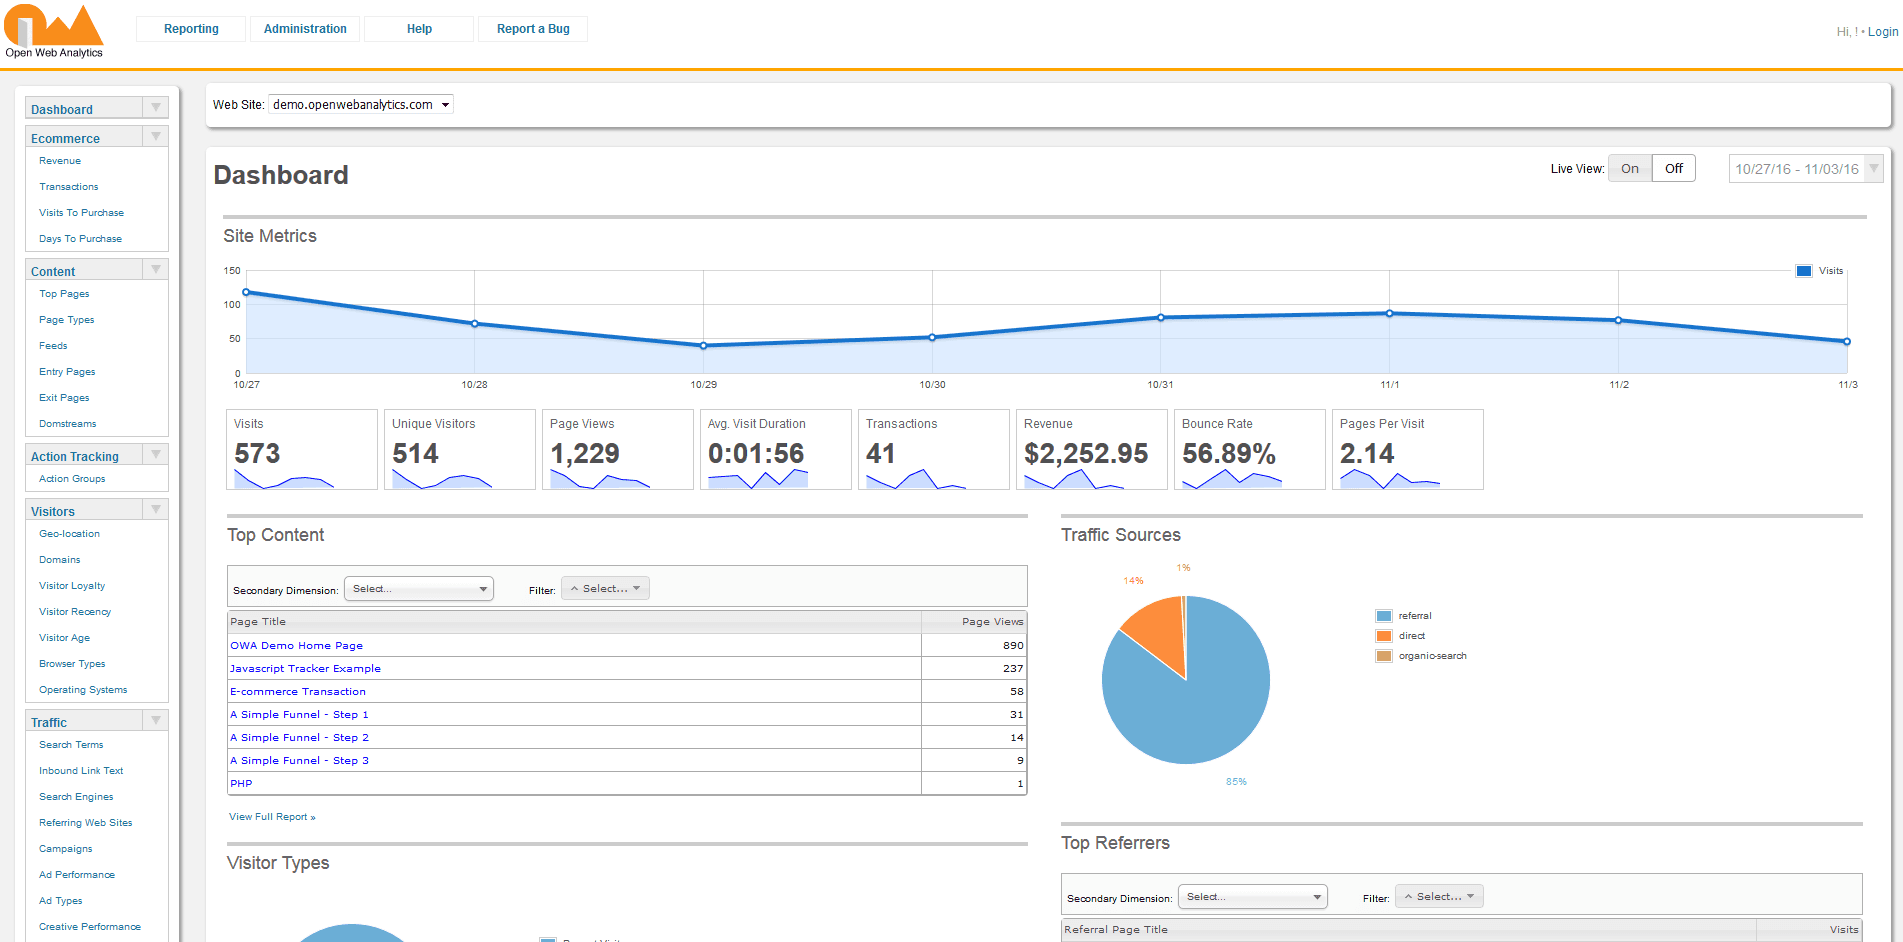
Open Web Analytics (OWA) caught my attention as another free alternative that’s completely self-hosted, making it a viable option for small business data analytics.
While it gives you total control and decent basic visitor tracking, I found its interface feels a bit dated compared to modern tools.
You’ll need server knowledge to keep it running smoothly as your traffic grows beyond a few thousand monthly visitors.
Features:
- Self-hosted with full data control
- Click-stream tracking and detailed visitor logs
- Customizable dashboards and reports
- Integration with WordPress and MediaWiki
- Supports multiple websites and campaigns
Pros:
- 100% free and open-source
- You host your own data — no third-party sharing
- Basic clickstream data, heatmaps, and session tracking included
- Simple integration with WordPress and some custom platforms
- Lightweight and works for small businesses with tight budgets
Cons:
- Outdated interface and poor user experience
- Limited integrations
- No predictive analytics or forecasting features
- No built-in customer segmentation or behavioral grouping
- No support for identity resolution
- Lacks advanced reports, eCommerce tracking, and funnel views
Who is it for: Designed for developers or small businesses that need basic analytics without giving up data ownership. It works well for simple websites but requires technical maintenance.
In the era of big data, having the right analytics tools is not just an advantage—it’s a necessity.
And while these tools can be good starting points but they come with their drawbacks.
Why these tools may still fall short for business owners
Here’s where I need to be completely honest with you. While the free tools I’ve mentioned are valuable, they share some common limitations that can frustrate small business owners.
- Limited scope: They’re primarily designed for tracking website behavior, not your entire business. If you’re selling across multiple channels (your own site, Amazon, Etsy, physical stores), these tools only show you a fragment of the picture.
- Technical burden: They require technical setup and ongoing maintenance. These analytics need proper configuration, event tracking setup, and regular updates. For busy business owners, this can quickly become another neglected task.
- Data without insights: This is the biggie, they provide data, not answers. You’ll see plenty of numbers, charts, and reports, but translating those into actionable business decisions? That’s entirely on you.
Free tools are great starting points, but as your business grows, consider solutions specifically designed for business owners rather than data analysts.
How Putler makes analytics easier for small business owners
Putler is a multichannel analytics tool.
If you are selling on Shopify, WooCommerce, or Amazon and using different payment gateways, Putler integrates with all of them to give you a unified view of your entire business.
You no longer need to switch between native analytics across different platforms. With Putler, all your business data is in one place.
The best part is that it is truly plug and play. Setup takes just a few minutes.
Putler offers over 200+ essential business metrics and a wide range of features. But here are a few favorites, just a quick sneak peek along with the impact they can make.
RFM segmentation
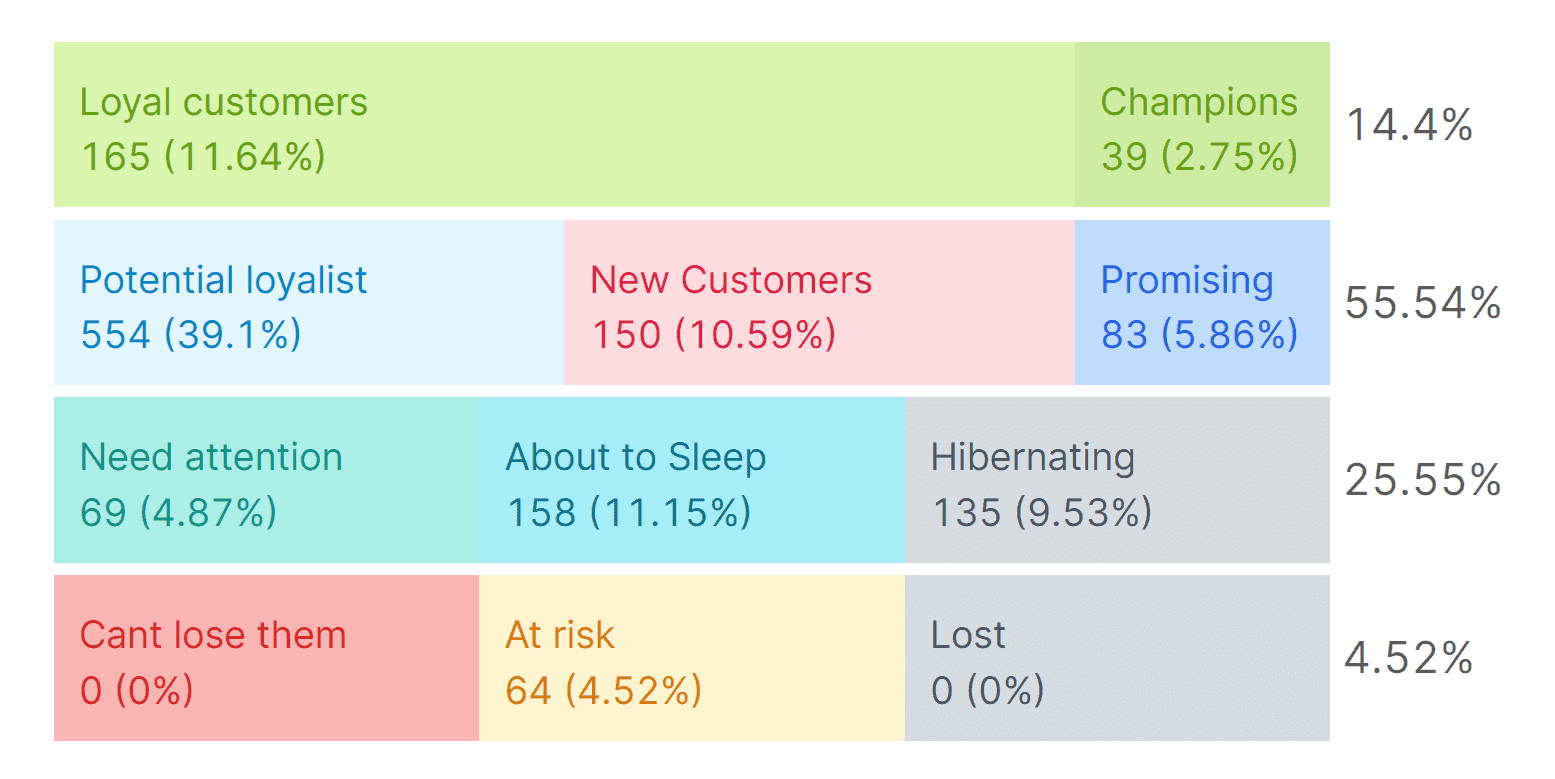
What it does: Instantly identifies your “champion” or customers who spend the most and shop frequently.
Sales heatmap
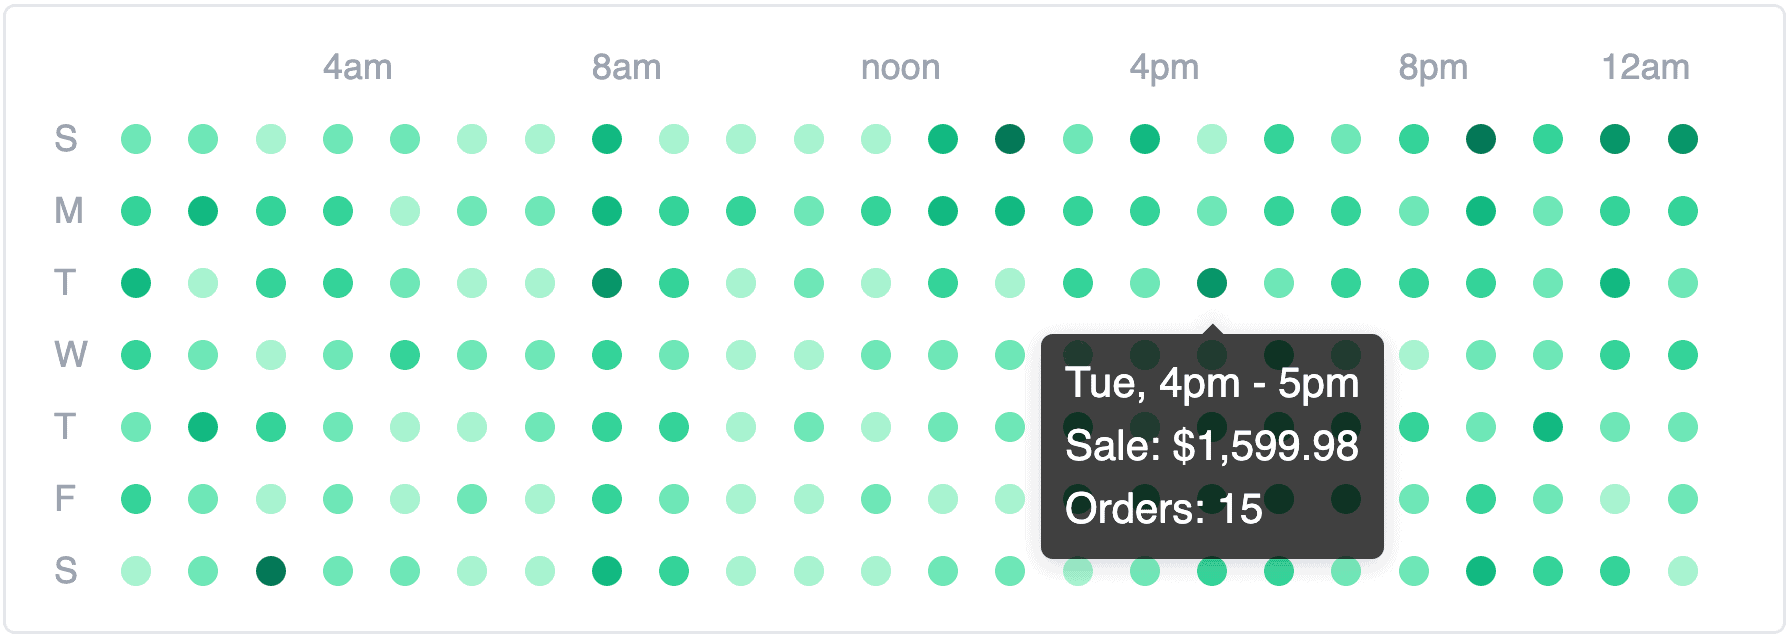
What it does: Shows you exactly which days and hours your customers love to shop.
Top sellers analysis
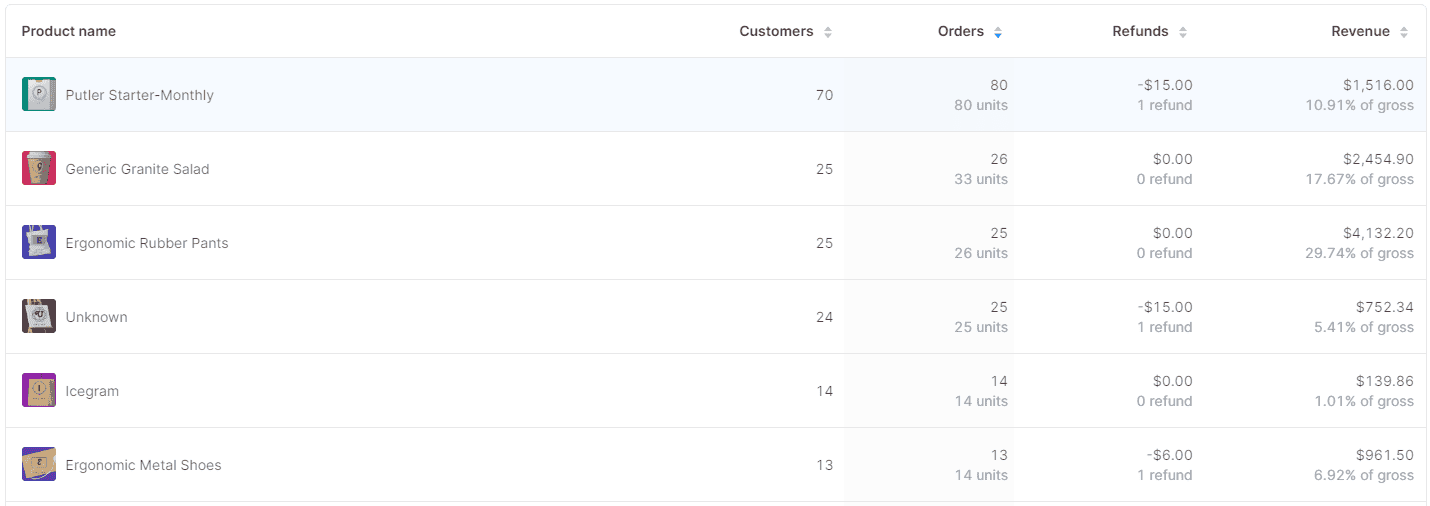
What it does: Highlights the 20% of products generating 80% of your revenue.
Cross-selling opportunities
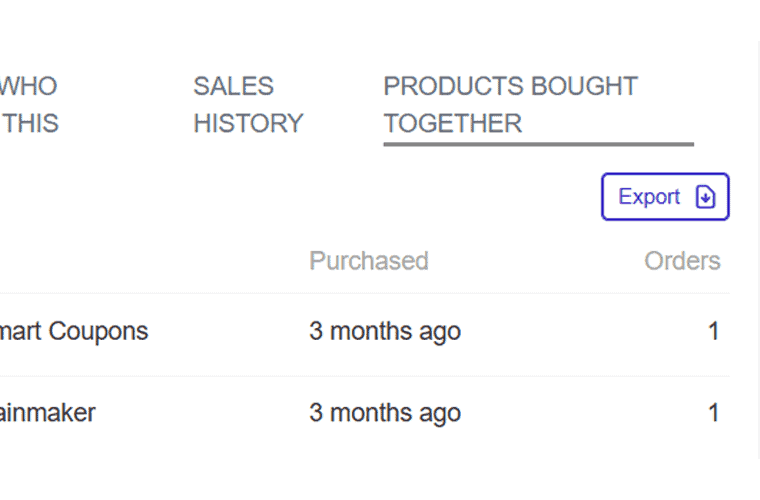
What it does: Reveals which products customers naturally buy together.
Activity log
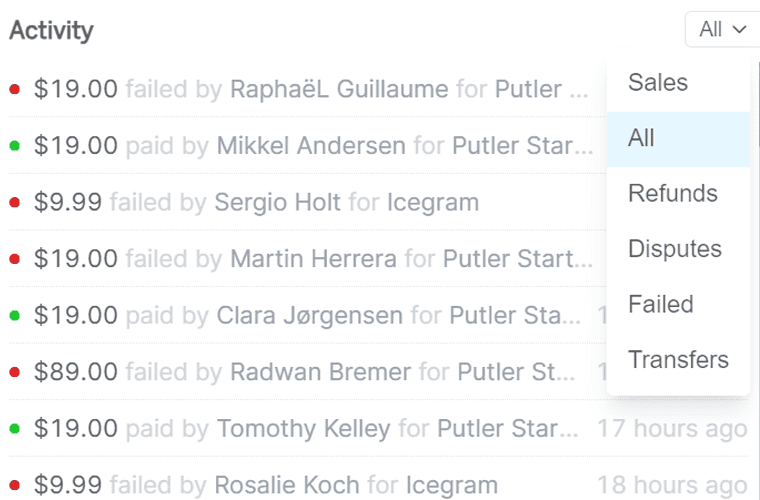
What it does: Shows real-time purchases, refunds, and transaction activity.
Multiple integrations
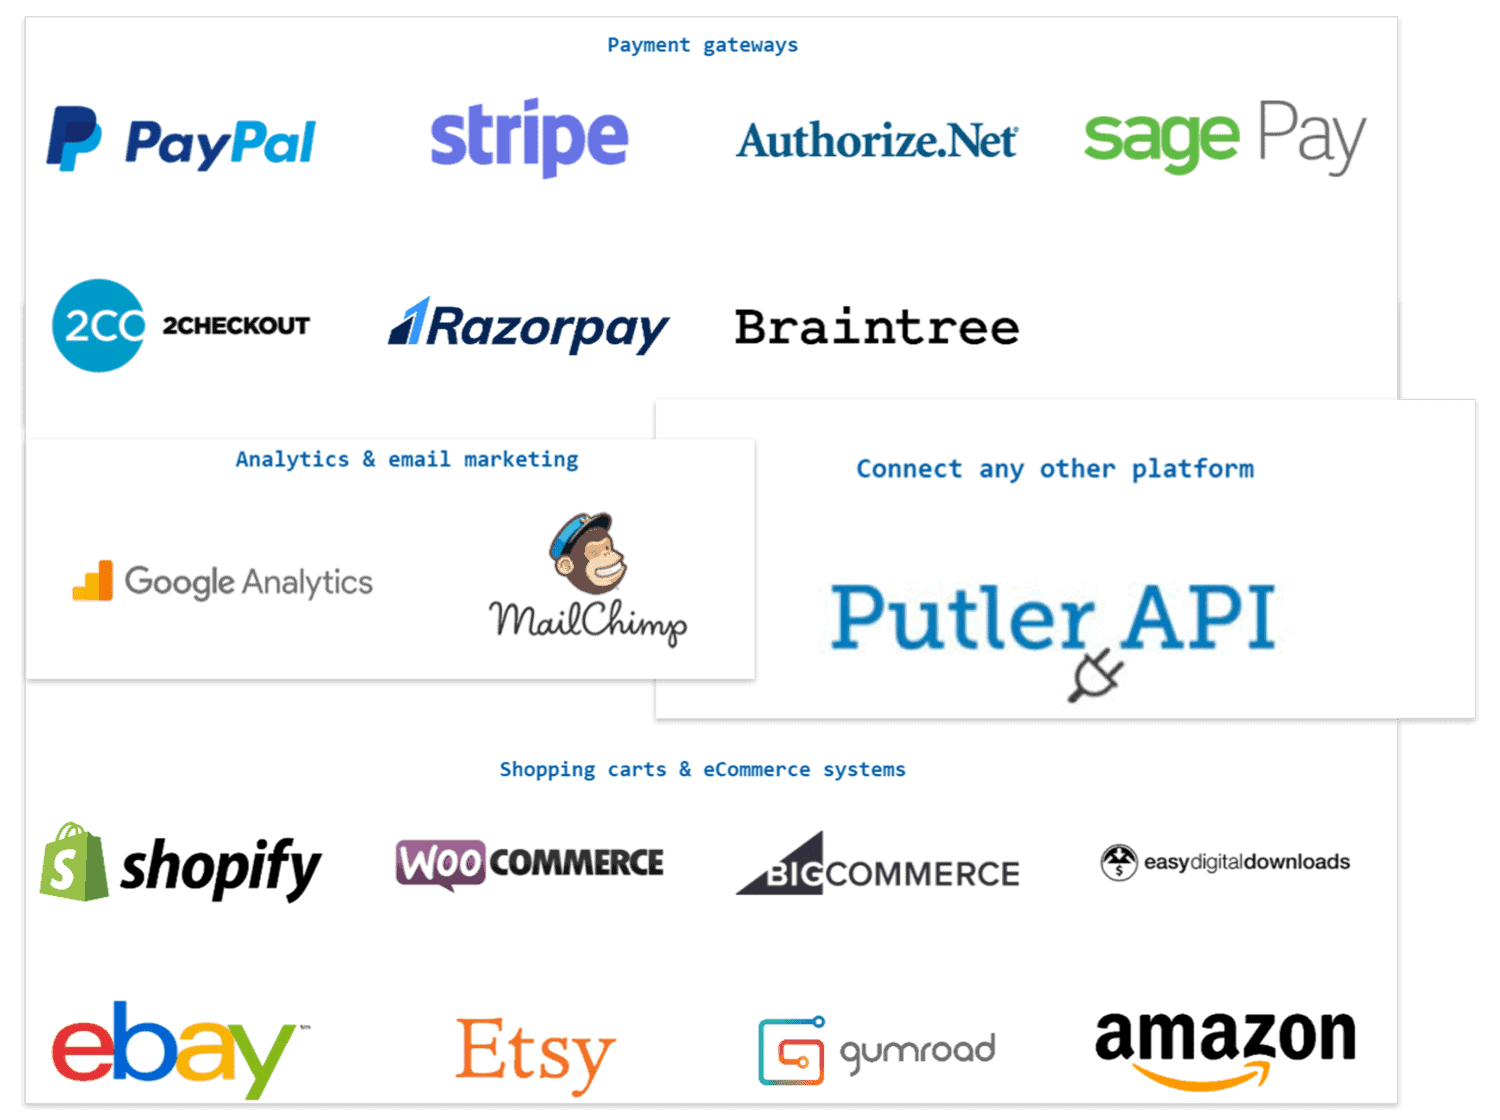
What it does: Brings together data from all your sales channels, payment processors, and marketing tools.
Web analytics
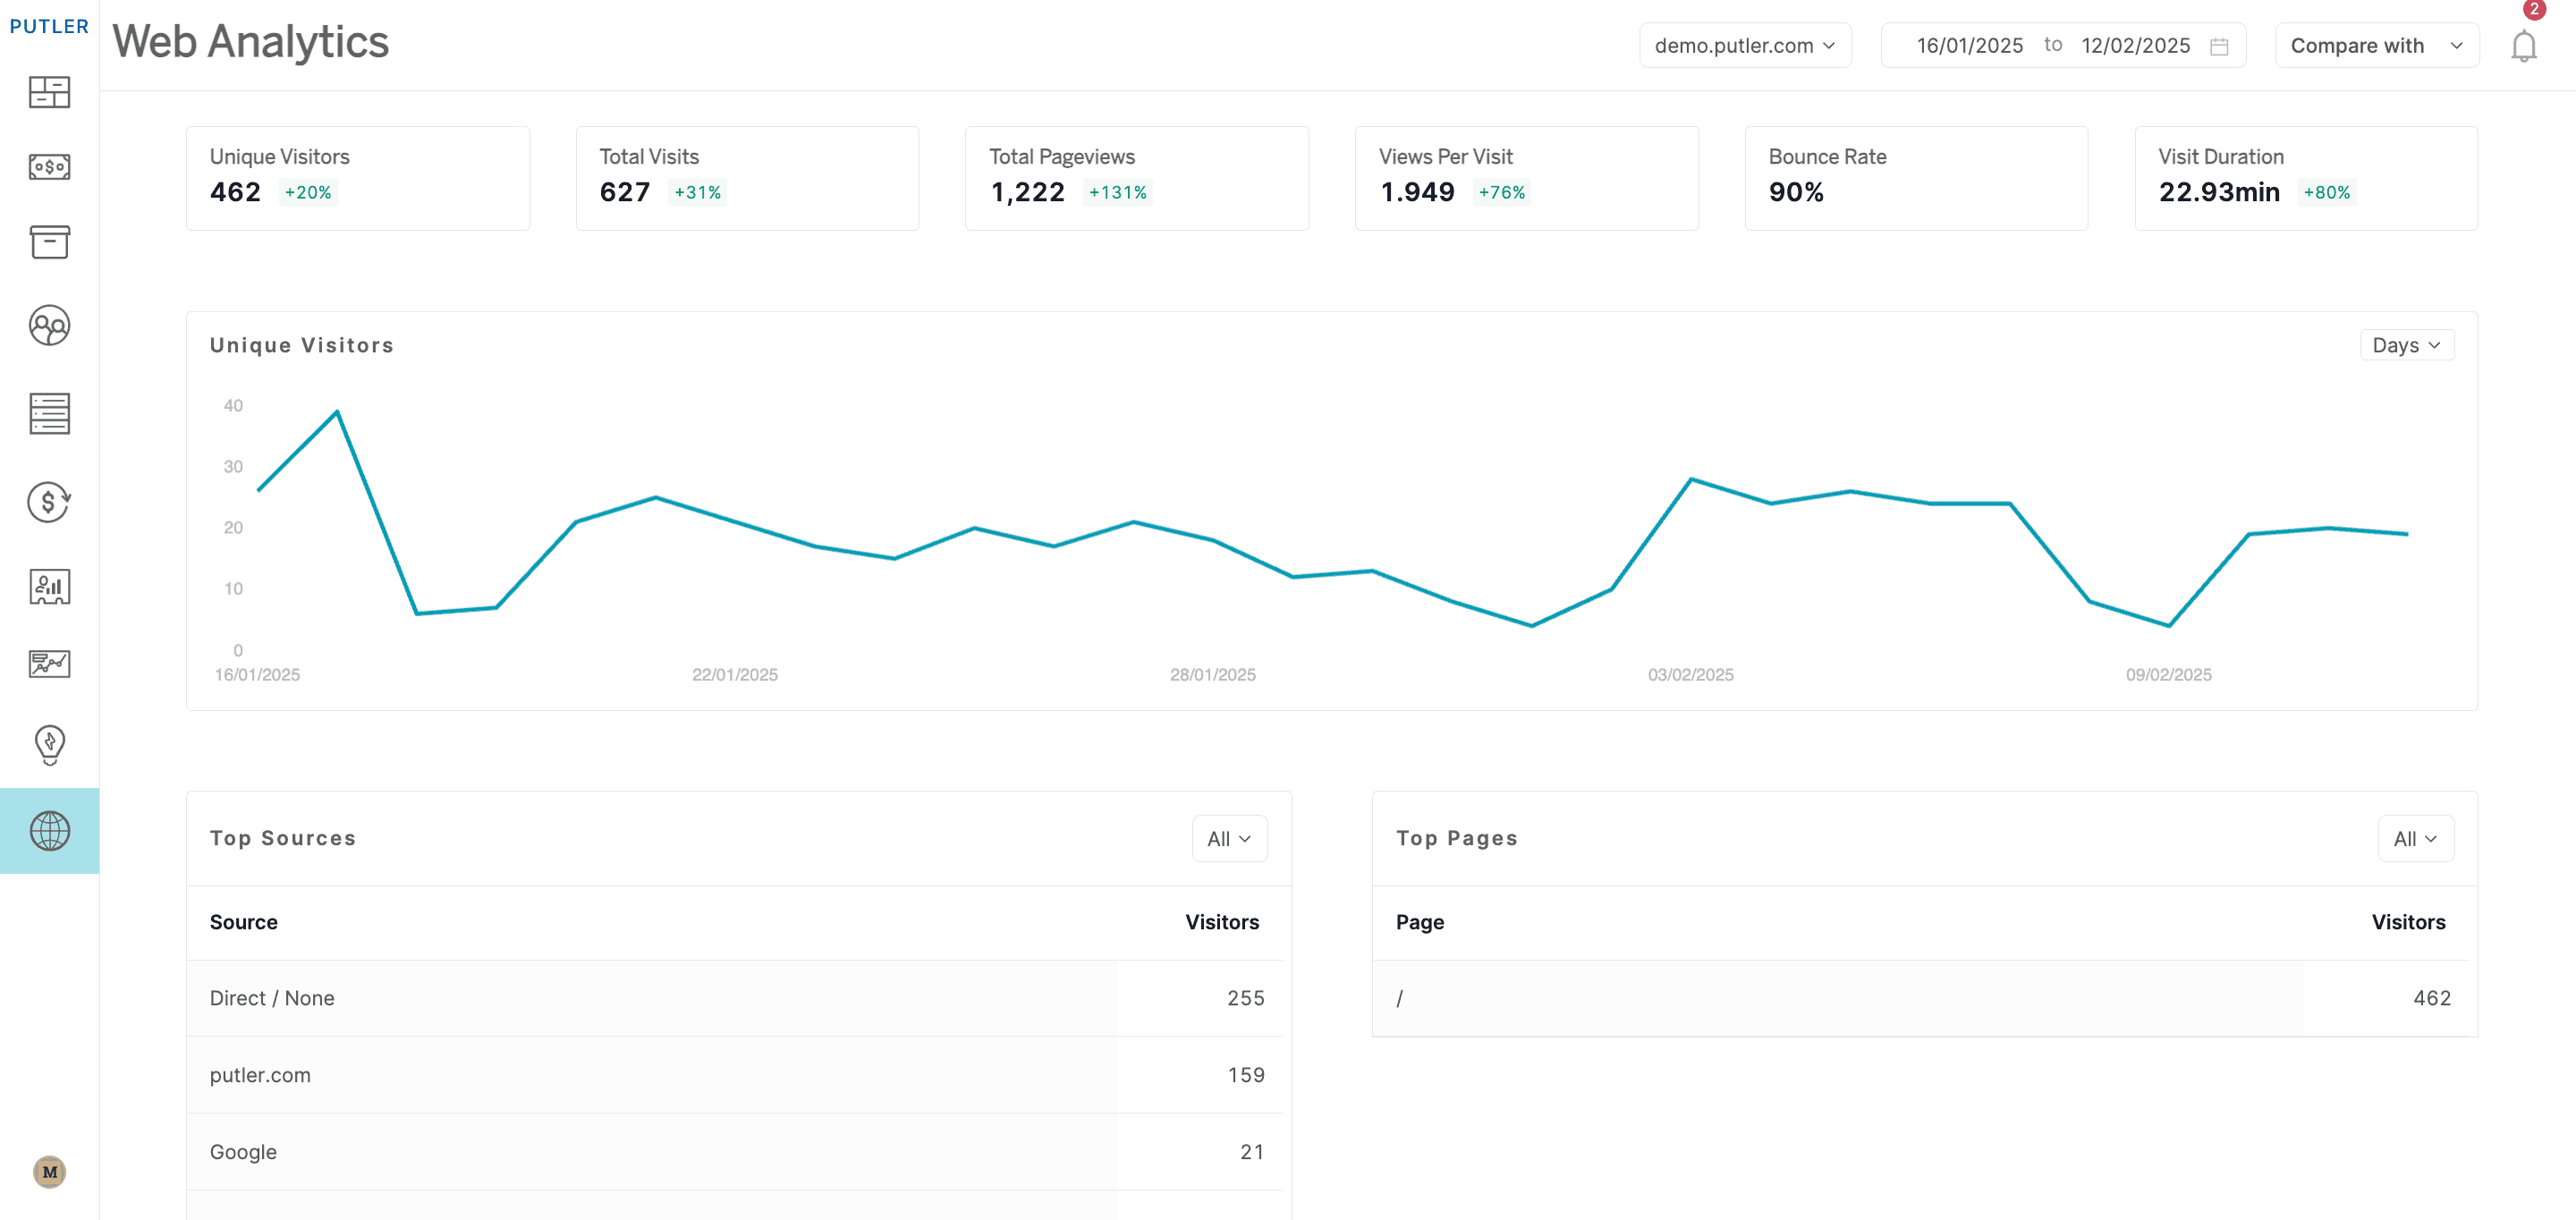
What it does: Tracks visitors, pageviews, bounce rates, and top-performing pages.
SaaS metrics
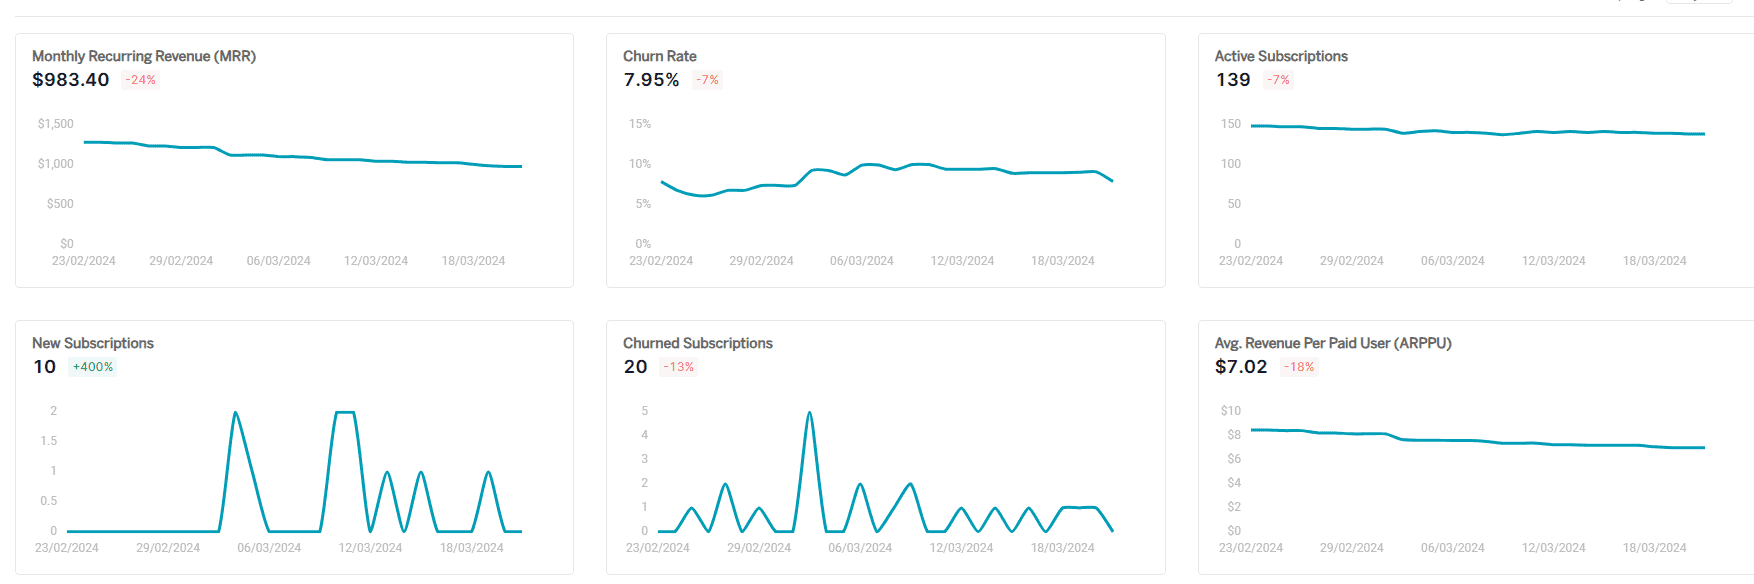
What it does: Calculates crucial metrics like MRR, churn rates, and customer lifetime value.
Customer segmentation
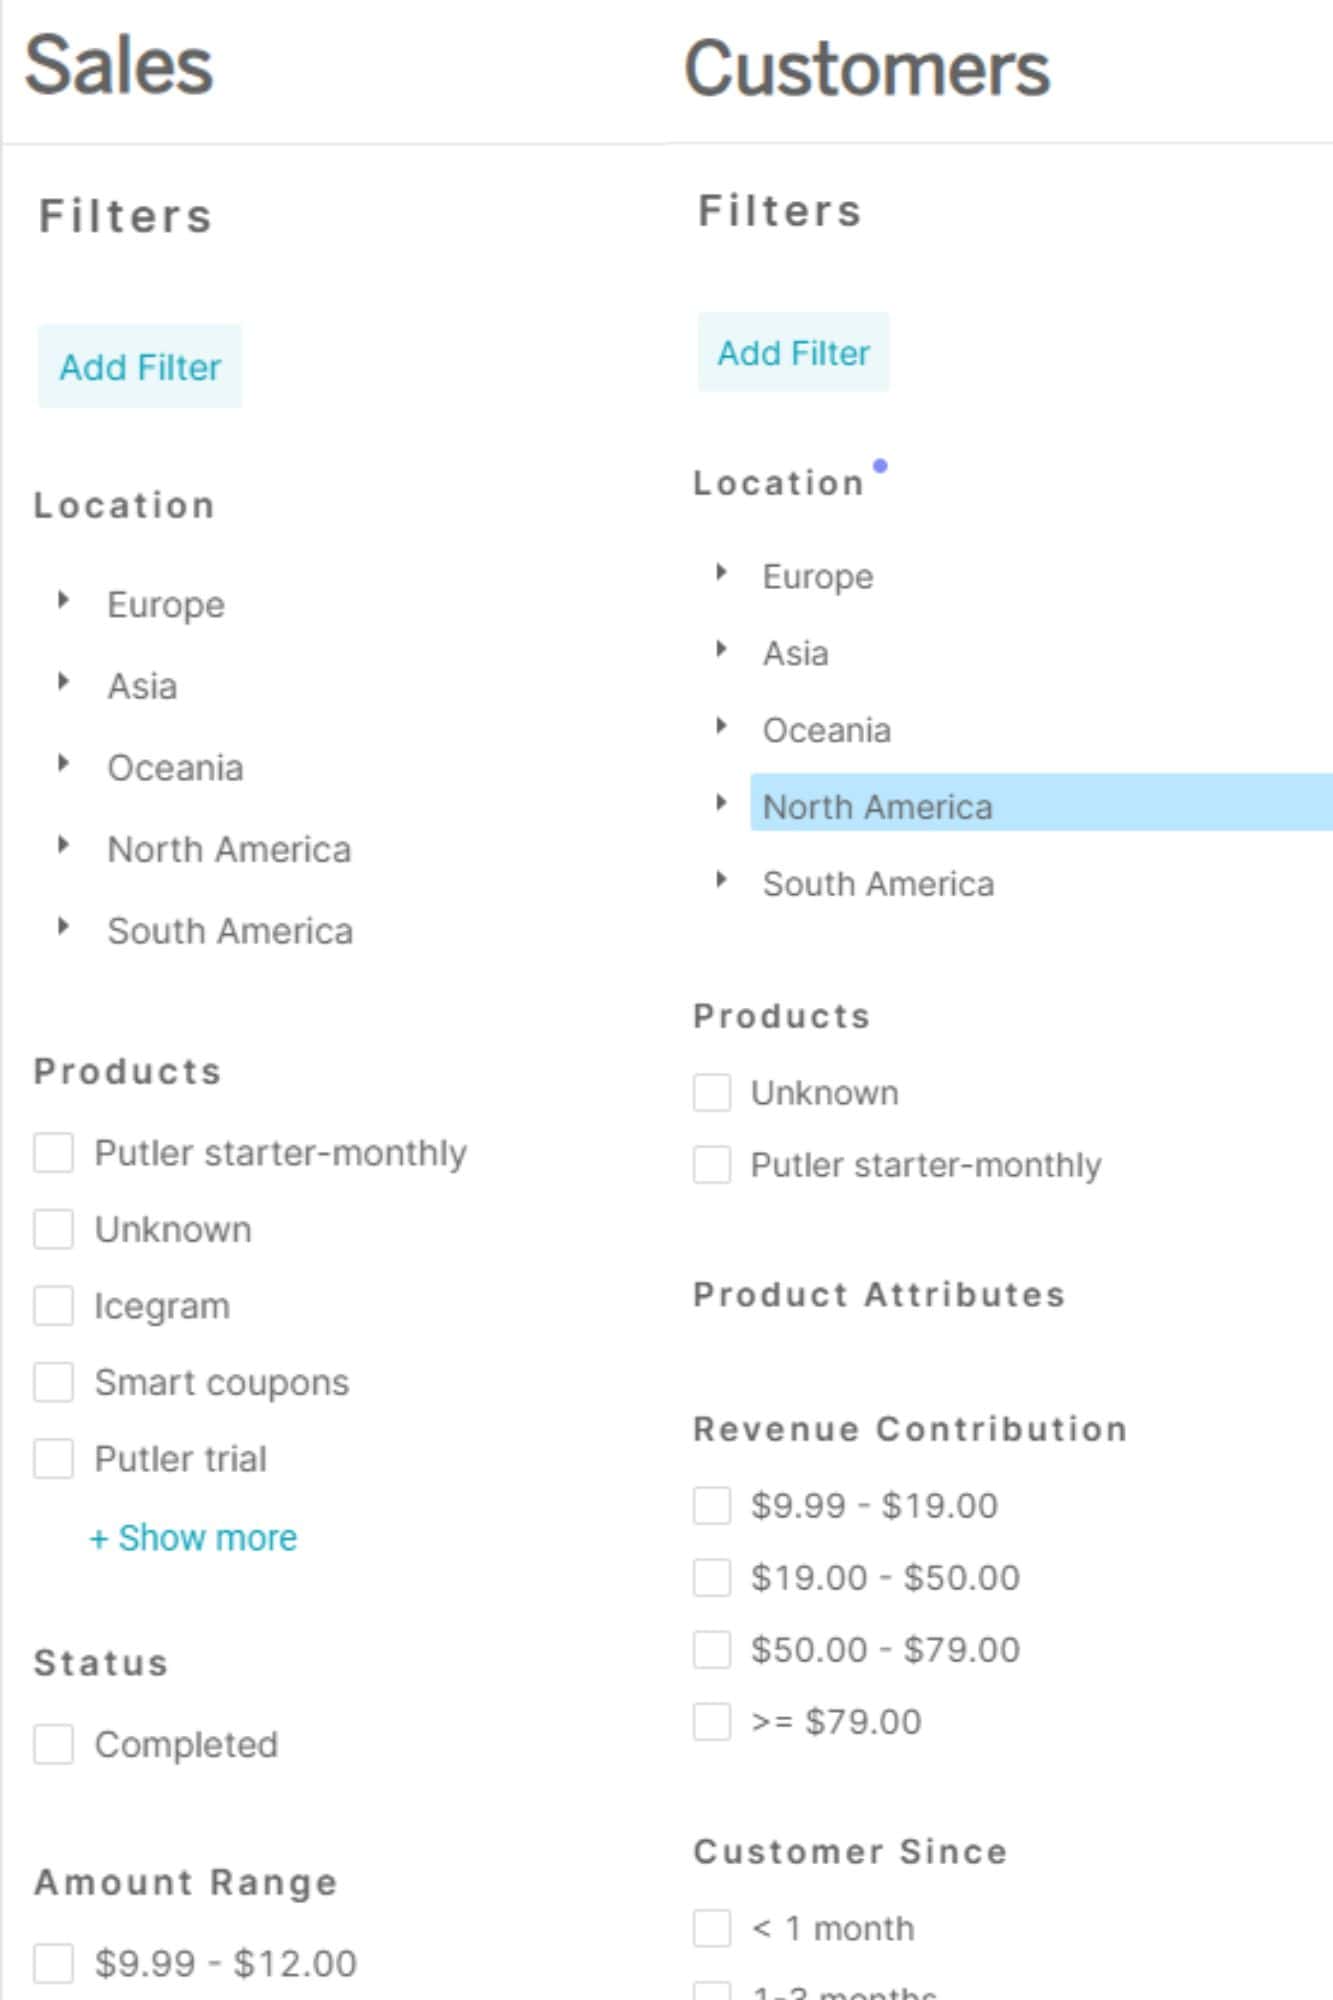
What it does: Creates targeted lists based on any combination of built-in filters.
Transaction history
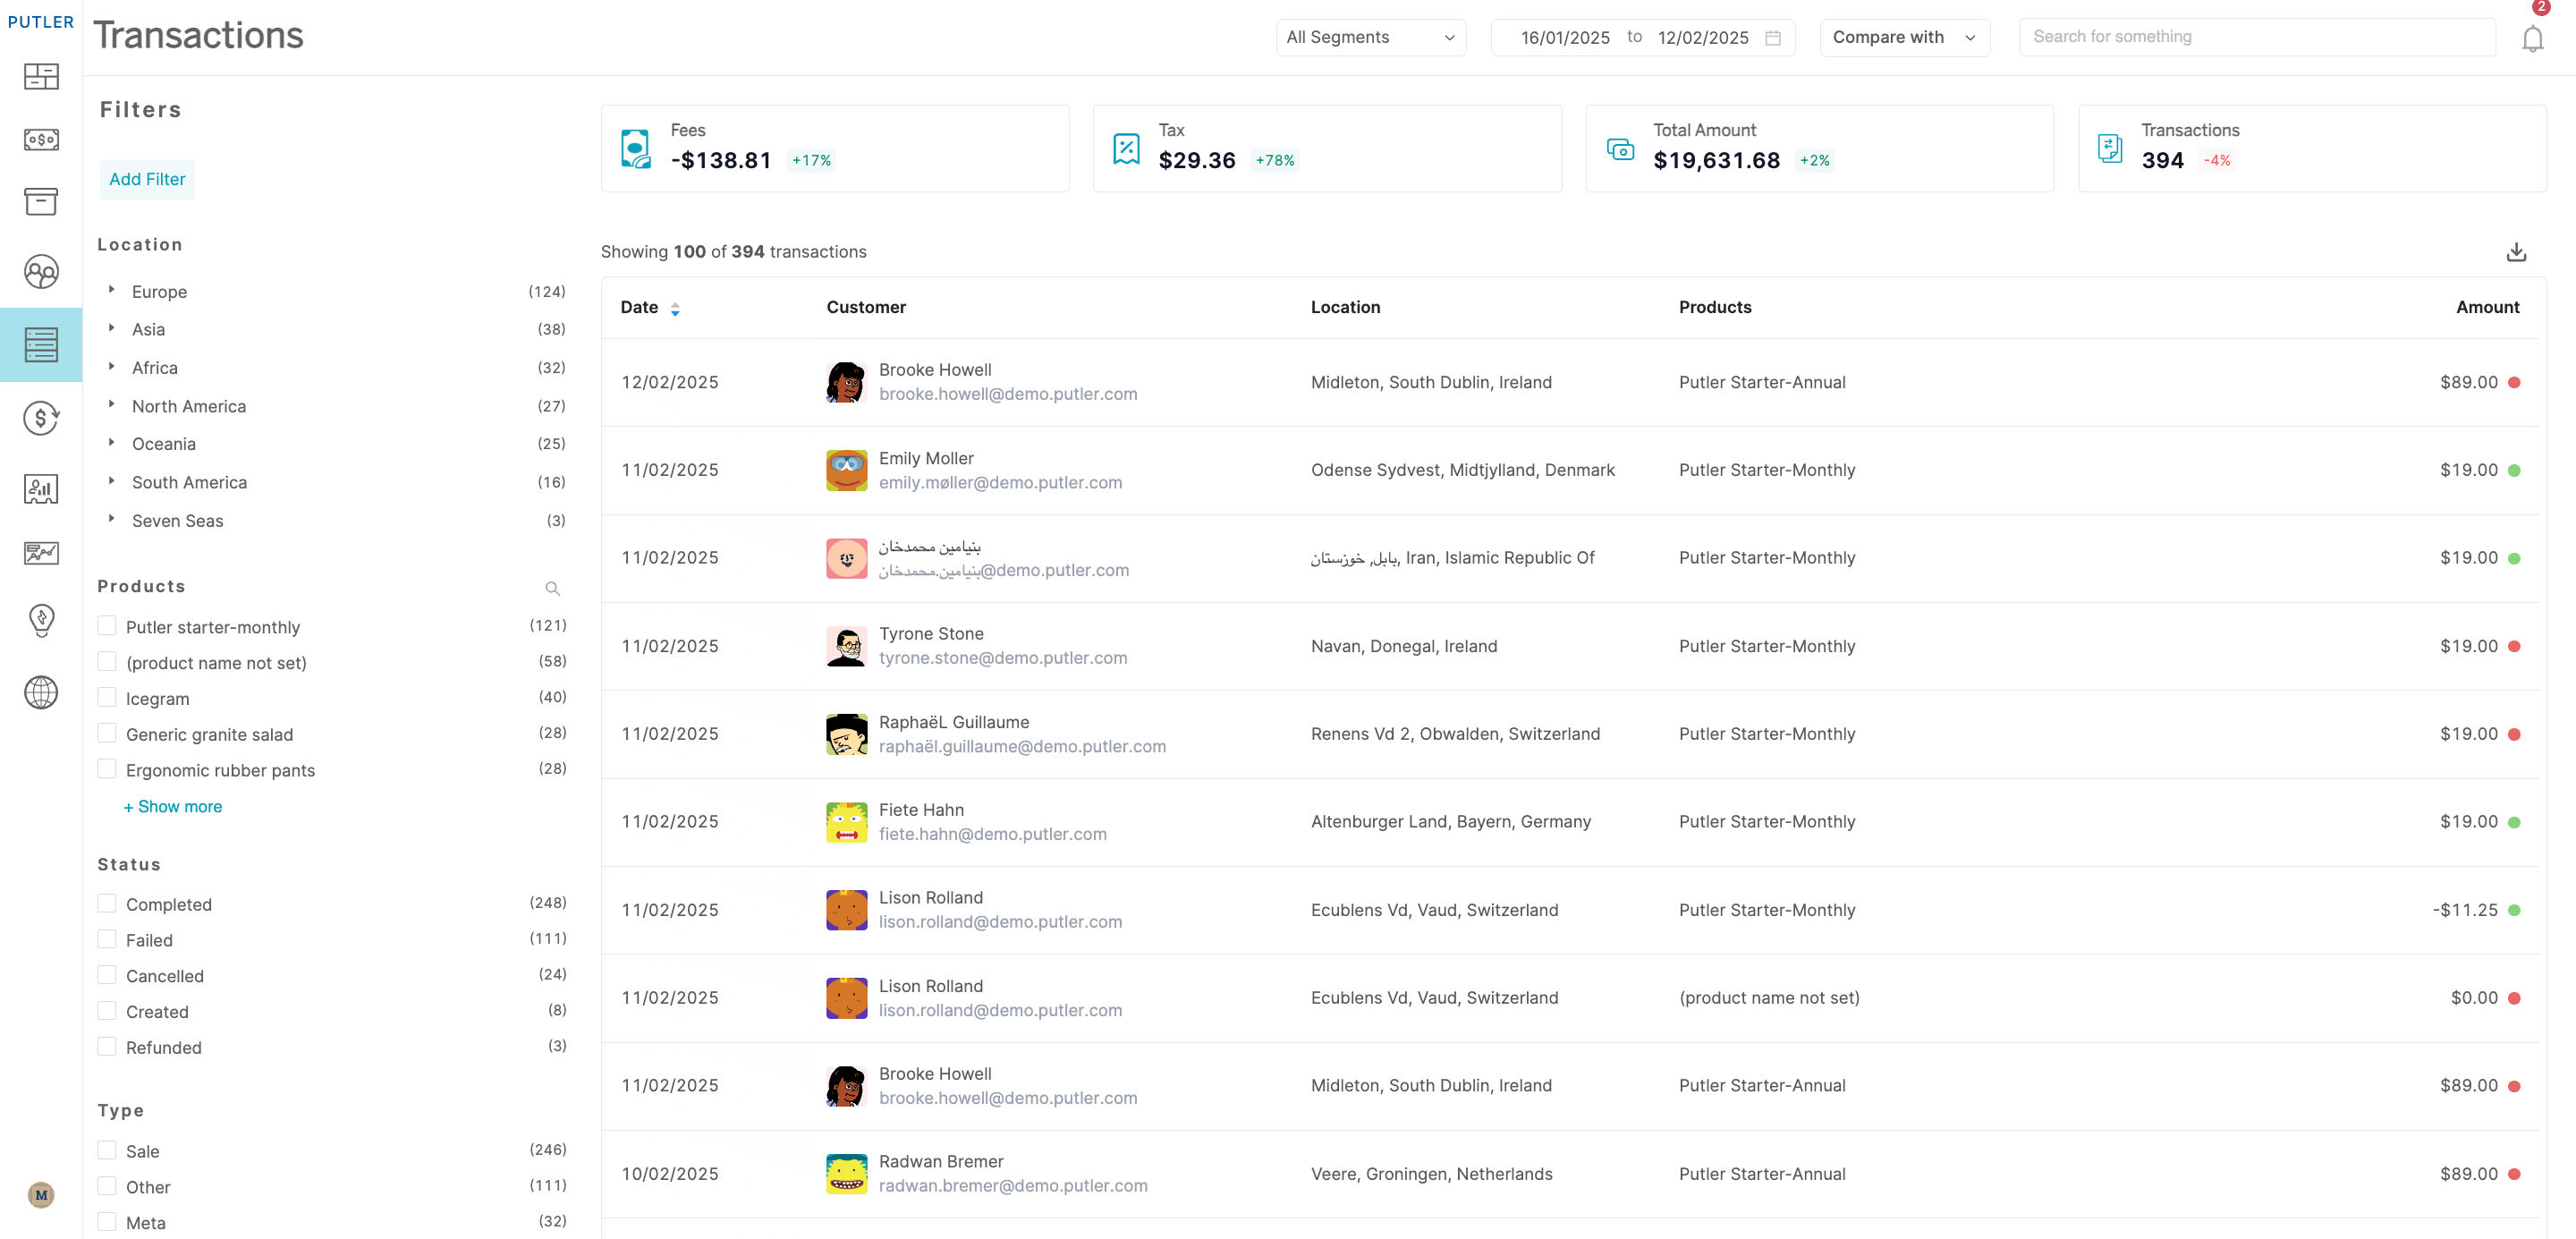
What it does: Maintains complete records of every transaction, including refunds and failed payments.
Who is it for: Built for ecommerce businesses and small businesses selling across multiple platforms. Perfect for those who want simple yet powerful, comprehensive business analytics without the tech hassle.
Summing it all up
You don’t need more data, just the right data. As a small business, it’s easy to feel overwhelmed by numbers. But focus on the few metrics that truly move the needle.
Track what matters, ignore the rest, and use those insights to make smarter decisions. When you get clear on your data, growth becomes easier, and a whole lot more fun.
FAQs
Do I need technical skills to use Putler?
No, Putler is designed with busy business owners in mind. The intuitive dashboard requires zero coding knowledge or technical expertise.
What integrations does Putler support?
Putler integrates with PayPal, Stripe, Razorpay, Shopify, WooCommerce, Etsy, Amazon, and more. It also works with Google Analytics and has an API if you want to build your own integration.
How’s it different from GA or Looker?
GA is complex. Looker for big companies. Putler is made for small businesses, it’s simple, clear, and gives you real insights that help you grow.
Does it work for SaaS/eCommerce businesses?
Yes. Whether you run a SaaS or an eCommerce store, Putler gives you tailored dashboards—like MRR and churn for SaaS, or product and customer data for eCommerce.