
Etsy analytics means tracking how your shop performs: what drives traffic, which listings convert, and where revenue actually comes from.
Etsy’s own Shop Manager gives you a starting point, but it stops short of the full picture serious sellers need.
This guide covers what Etsy analytics includes, where the native dashboard and Google Analytics fall short, which metrics actually predict growth, and how tools like Putler fill the gaps.
What is Etsy analytics

Etsy analytics is the practice of measuring your shop’s traffic, conversion, and revenue data to understand what’s working and what isn’t. It covers three layers: how many people see your listings, how many of them buy, and how much revenue those purchases generate.
Most sellers check numbers without a system. They glance at views, feel good or bad about the day, and move on. Etsy analytics turns that habit into a process you can repeat: consistent metrics, tracked over time, tied to decisions like pricing, photos, or keywords.
The goal isn’t to collect data for its own sake. It’s to answer three questions on repeat: where are your visitors coming from, why aren’t they converting, and which products deserve more attention.
Etsy’s native Shop Manager Stats

Shop Manager Stats is Etsy’s built-in reporting tool, and it’s the first place you’ll look as a seller. It shows visits, views, orders, revenue, and a rough breakdown of where your traffic comes from: Etsy search, direct traffic, social, and Etsy Ads.
For a quick daily check, that’s enough. For anything deeper, it isn’t. The limits show up fast:
- No customer segmentation. It groups every visitor and buyer into one bucket, with no way to separate one-time buyers from repeat customers.
- Limited history. Data only goes back to November 2017.
- No profit view. It shows revenue, not what’s left after fees, shipping, and costs.
- No multi-shop reporting. Running more than one store means checking each shop separately.
- No forecasting. There’s no way to project next month’s revenue from current trends.
A full walkthrough of every Shop Manager section, including listings, orders, and finances, is in the Etsy dashboard guide.
Adding Google Analytics to your Etsy shop
Google Analytics 4 (GA4) is free, and it sees what Etsy’s dashboard doesn’t: where visitors came from before they landed on a listing, how they moved through your shop, and how many left without buying. Connecting it takes about ten minutes.
The setup happens in two places. First, create a GA4 property at analytics.google.com and add a web data stream using your Etsy shop’s URL. That gives you a Measurement ID in the format G-XXXXXXXXXX.
Second, paste that ID into Etsy. Go to Shop Manager, then Settings, then Options, then the Web Analytics tab. Drop the Measurement ID into the Web Property ID field and save. Data can take up to 24 hours to start showing up, according to Etsy’s own setup guide.
Here’s the catch: GA4 tracks visitor behavior, not sales. Etsy controls checkout, so order and revenue data never reaches Google Analytics.
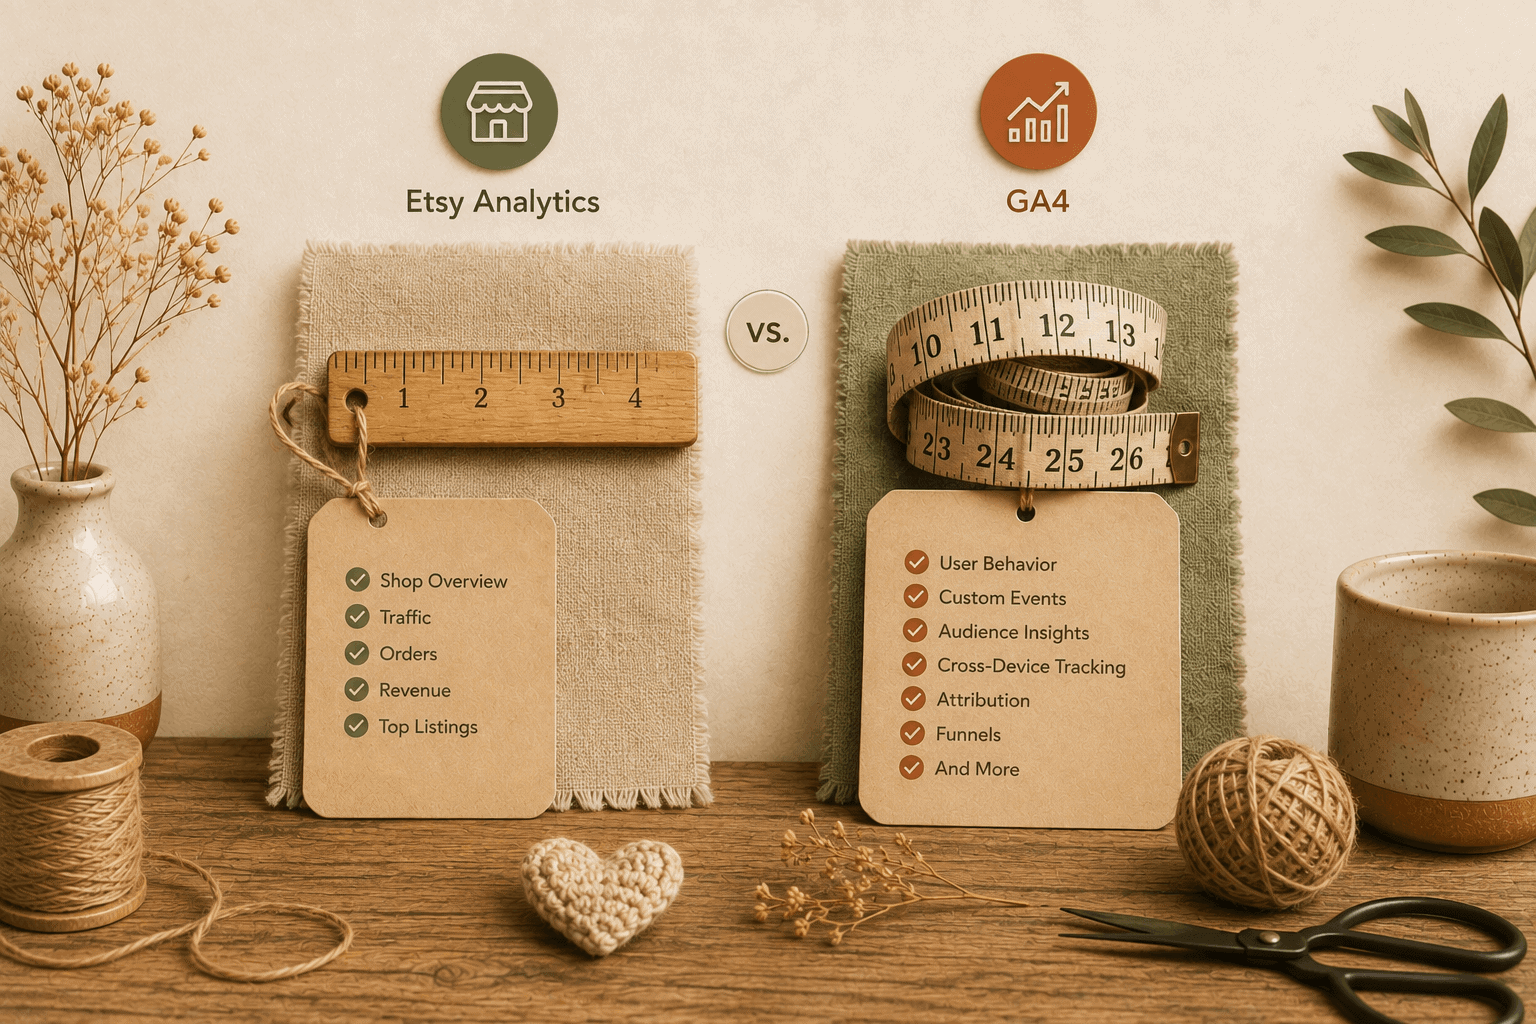
You’ll see traffic patterns clearly and still have zero idea which visits turned into money, unless you cross-reference it against Etsy Stats by hand.
A full click-by-click walkthrough is in the Etsy Google Analytics setup guide.
Etsy analytics tools worth considering

With 8.1 million active sellers competing for 86.6 million buyers in 2026 (Yaguara), Etsy Stats and GA4 together still leave gaps. Neither shows profit after fees, segments customers by value, or consolidates data if you run more than one shop.
Third-party tools fill those gaps, and they split into a few categories:
- SEO and keyword tools, like Marmalead and Alura, focus on what shoppers search for and how to rank higher.
- Social scheduling tools, like Sked Social, handle posting and campaign tracking across platforms.
- Competitor and pricing tools, like Sale Samurai, track what similar shops charge and how they’re ranking.
- Consolidated analytics platforms, like Putler, pull sales, customer, and traffic data into one dashboard, especially useful once you’re running more than one shop or selling beyond Etsy.
Which category matters most depends on what’s actually missing. A shop with steady traffic but flat sales needs conversion and customer data more than another keyword tool. A shop just getting started probably needs SEO help first.
The full side-by-side comparison of 10 tools is in the Etsy analytics tools guide, and a role-by-role breakdown of nine seller apps is in the best Etsy seller apps guide.
The metrics that actually matter

Etsy Stats and GA4 hand you dozens of numbers. Only a handful actually predict growth. These are the ones worth watching every week:
- Conversion rate: The share of visitors who buy. Industry estimates put a solid Etsy conversion rate around 1% to 3%, with jewelry shops often running higher near 4.5% and shops above 5% counted as top performers, according to Gelato’s 2026 benchmark analysis. Below 2%, something in the listing, price, or photos usually needs attention.
- Traffic source mix: How much comes from Etsy search versus Etsy Ads versus outside channels like Pinterest or Instagram. A shop leaning entirely on Etsy search has no backup if the algorithm shifts.
- RFM segments: Recency, frequency, and monetary value group customers into buckets like champions, loyal, and at-risk. It answers a specific question: who’s worth emailing first.
- Sales heatmap: Which days and hours actually convert, so promotions land when buyers are already looking.
- Revenue forecast: A projection based on current trends, useful for planning inventory and cash flow instead of finding out you’re short after the fact.
None of these live inside Etsy Stats by default. Order data, RFM segmentation, and forecasting are why sellers add a tool on top. The 11 strategies to increase Etsy sales walks through how each metric ties to a specific action.
Common problems your data can solve
Two problems come up constantly, and both are analytics problems in disguise.
Views but no sales
Traffic isn’t the issue: something between the click and the purchase is broken. Usually it’s pricing that doesn’t match the search intent, photos that don’t hold attention, or a listing that ranks for the wrong keyword entirely. Checking which search terms bring visitors, then checking where those visitors drop off, usually points straight at the fix. Six specific ways to fix it cover the most common causes in detail.
Running shops without one number to check
Etsy allows any number of shops under one seller as long as each has its own account and the owner discloses all shops in each public profile. Nothing stops you from opening a second shop for a different product line. But Etsy won’t consolidate the numbers for you. Every shop means another dashboard, another login, another set of stats to cross-reference by hand. The full guide to managing multiple Etsy shops covers the setup rules and the tools built for consolidated reporting.
Putler for Etsy sellers
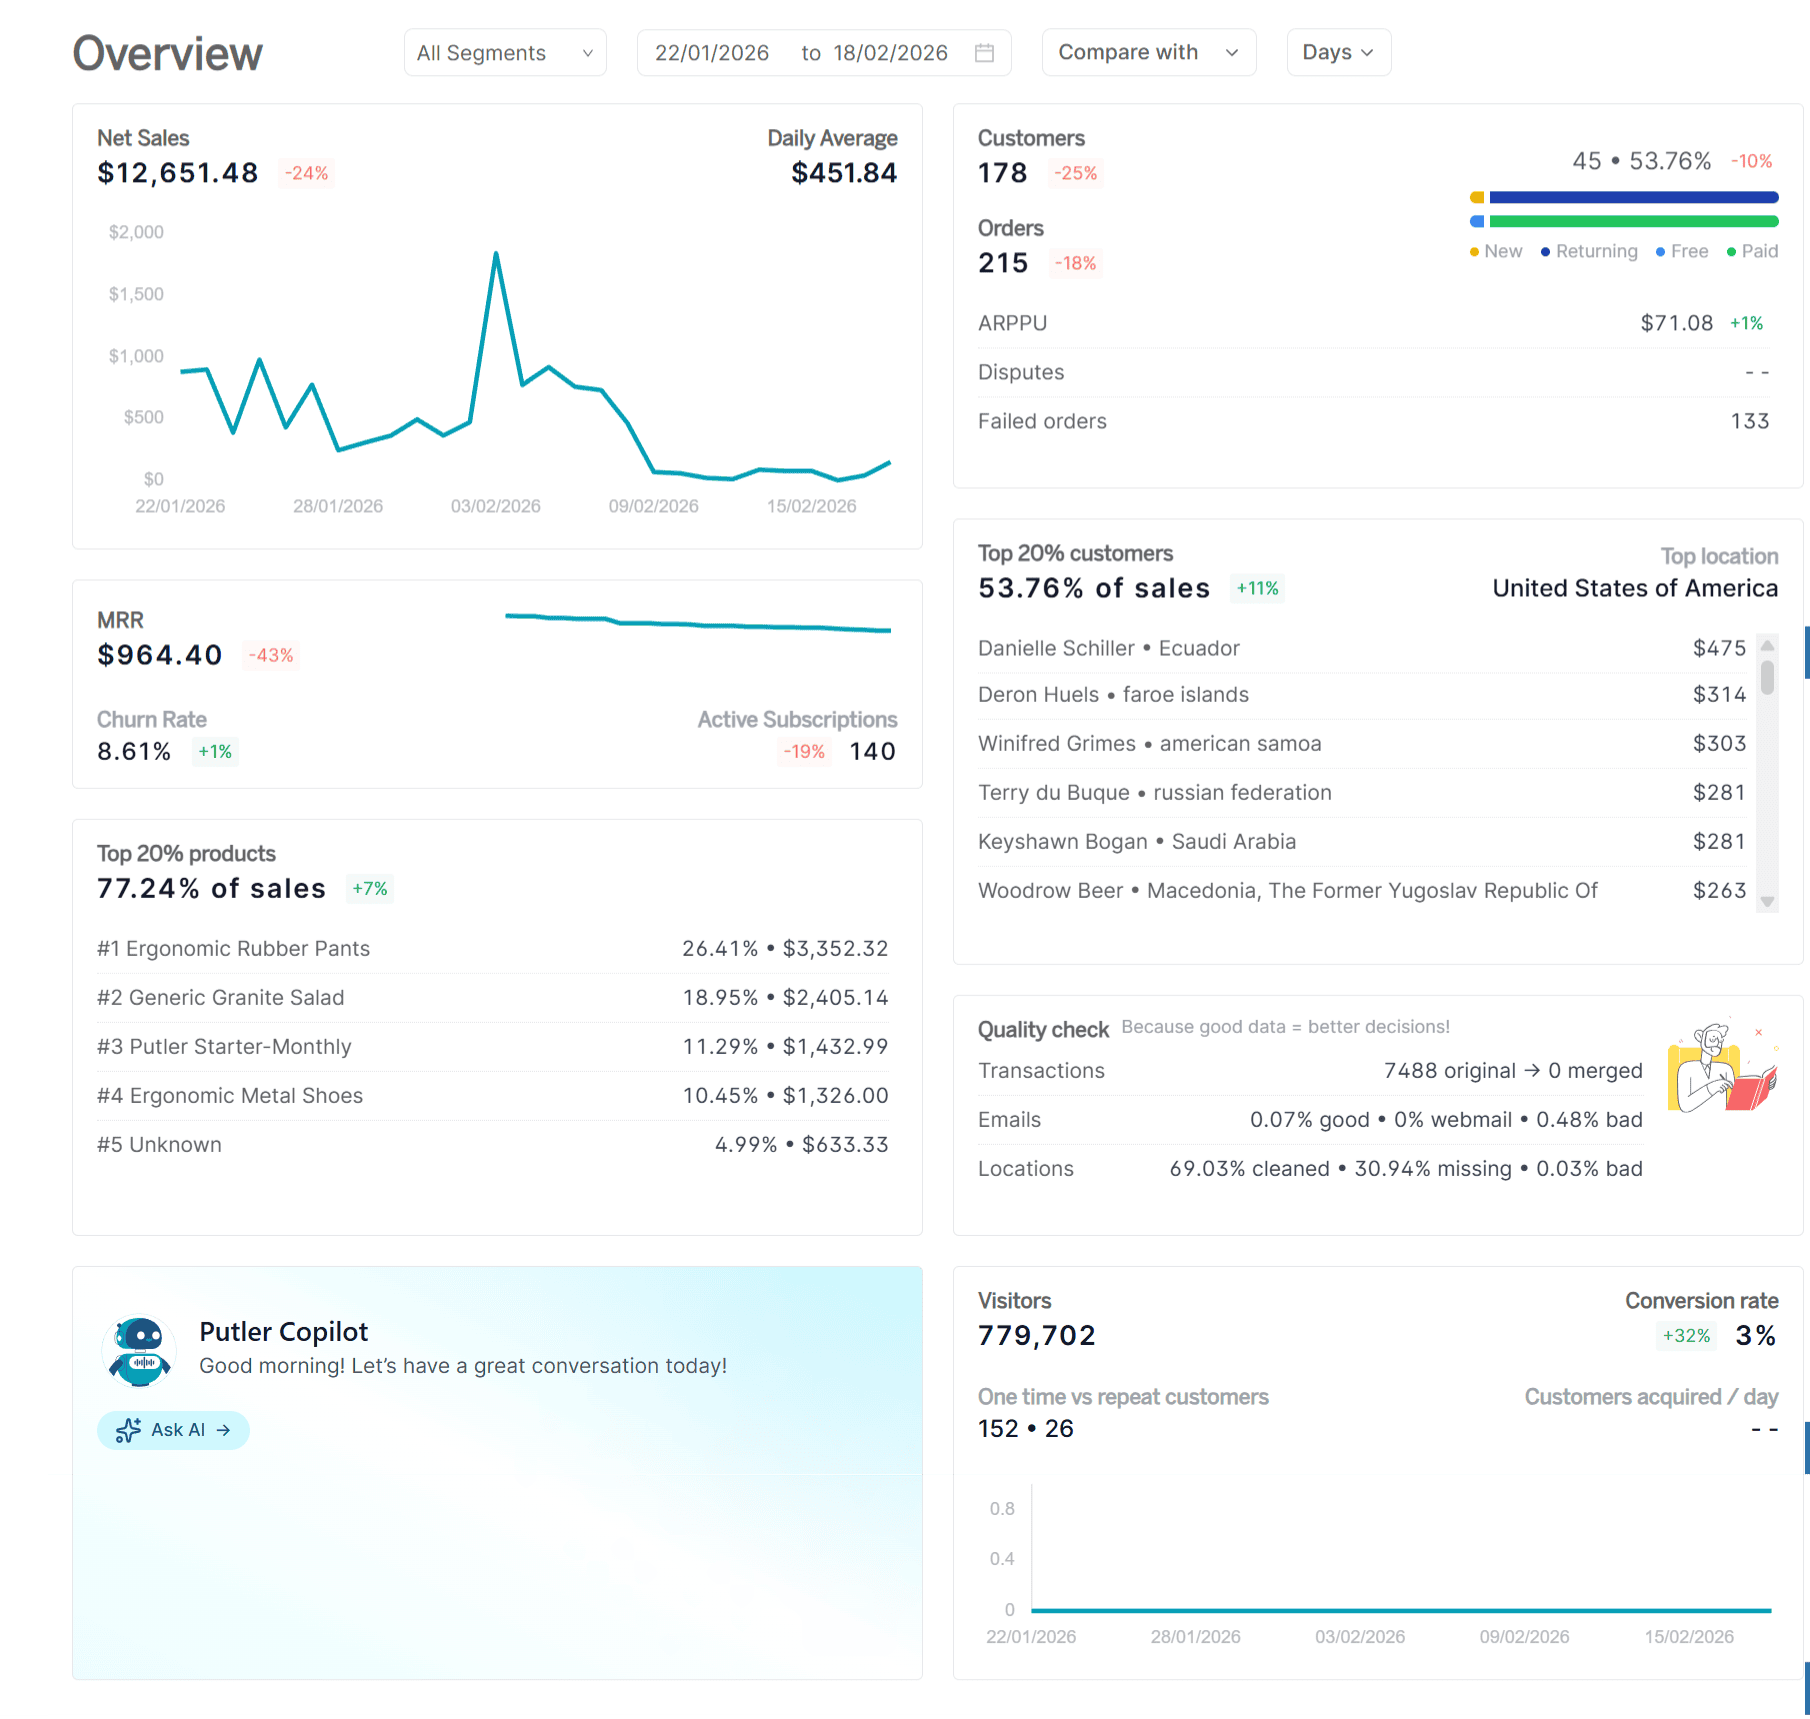
Putler pulls sales, order, and customer data from Etsy and up to 17+ other sources like Shopify, WooCommerce, PayPal, and Stripe into one dashboard. For a seller running only Etsy, that means every metric Etsy Stats leaves out. For a seller running Etsy alongside other channels, it means one number instead of five separate logins.
What it adds on top of Etsy Stats:
- RFM segmentation. Customers sorted into segments like champions, loyal, and at-risk, based on how recently, how often, and how much they buy. You’ll know exactly who to email before a launch.
- Sales heatmap. A visual of which days and hours actually convert, so promotions and new listings go live when buyers are looking.
- Revenue forecasting. A projection based on current trends, built from 153+ pre-built metrics tracked across every connected store.
- Multi-shop consolidation. Connect every Etsy shop you run, plus any other sales channel, and see them together or broken out individually.
- Customer profiles. Full purchase history, location, and contact details per customer, not just an anonymous visitor count.
Setup takes minutes: connect the Etsy shop, and historical orders start populating automatically.
Putler isn’t complete for every seller. There’s no inventory management built in, and no dedicated mobile app, so shops that need stock tracking on the go will still need a separate tool for that piece. What it does cover, it covers with more depth than Etsy Stats or GA4 alone.
Pricing starts at $20 a month for shops earning up to $10,000 monthly, scaling with revenue from there. The 14-day trial requires no credit card.
FAQs
What is Etsy analytics?
Etsy analytics is the data on your shop’s traffic, conversion, and revenue, available through Etsy’s built-in Shop Manager Stats, an added Google Analytics 4 connection, or a third-party tool like Putler.
Does Etsy have built-in analytics?
Yes. Shop Manager Stats tracks visits, views, orders, revenue, and basic traffic sources for free, though it stops at customer segmentation, profit, and multi-shop reporting.
How do I see analytics on Etsy?
Log in to Shop Manager and open the Stats tab for the built-in dashboard. For deeper data, connect Google Analytics 4 through Settings, Options, Web Analytics, or connect a third-party tool like Putler for consolidated reporting.
What is a good conversion rate on Etsy?
A conversion rate between 1% and 3% is typical, with top-performing shops crossing 5%. Below 2% usually signals an issue with pricing, photos, or listing keywords.
Etsy analytics: the bottom line
Etsy Stats answers the basic questions. GA4 adds traffic depth. Neither shows profit, segments customers, or works across more than one shop. That gap is what determines whether growth stays a guess or becomes a repeatable process.
Start with what’s already free: check Shop Manager Stats weekly, connect GA4 if you haven’t, and track conversion rate above anything else. Add a consolidated tool once the manual cross-referencing starts costing more time than it saves.

