Have you ever felt overwhelmed by endless data reports? You are not alone.
With so much data to deal with today, making sense of it and turning it into actionable insights is a challenge.
This is where an analytics dashboard can help you.
Analytics dashboards distill your most important business data into clear, visual, and actionable insights.
This helps you track performance, spot trends, and make important decisions faster.
However, dashboards are just one part of the bigger picture. If you want to understand how all your data fits together and how to truly leverage it, check out our complete guide on eCommerce analytics.
In this article, we will focus specifically on analytics dashboards, what they are, why they matter, and how they can help you streamline various aspects of your eCommerce business.
Let’s get started.
What is a dashboard in data analytics?
A data analytics dashboard is a visual representation of key metrics, data points, and performance indicators of a business.
It consolidates and displays complex data into easily digestible charts, graphs, tables, etc.
Dashboards collect data from multiple sources and integrate them into a single dashboard for a centralized view.
This helps owners get a consolidated picture of their entire business and acts as a guide for important decisions.
Why use an analytics dashboard?
Using an analytics dashboard is important for various reasons.
Let’s discuss them one by one.
- Real-time data monitoring
Dashboards provide real-time insights. They help you track KPIs and other important metrics in real time, enabling you to make timely decisions.
- Data visualization
The dashboard presents complex data in an easy-to-understand format using charts, graphs, and other visuals.
This makes data more accessible and enables better analysis and decision-making.
- Improved decision-making
A dashboard helps you collect data in one place and get a comprehensive view of your business operations.
This allows you to make better and more informed decisions based on accurate and updated information.
- Goal tracking
An analytics dashboard helps you track progress towards your goal. It provides a clear picture of your business and its performance over time.
This helps in identifying hidden trends, strengths, and areas for improvement.
- Increased efficiency
A dashboard improves efficiency and saves time for business owners and key decision-makers.
One can easily use the data displayed on the dashboard to make efficient decisions and reduce manual errors.
Now, you must be wondering, since there are so many things we can do with analytics dashboards, there must be specialized dashboards too.
So, yes, there are. Let’s dig deeper into them.
What are the different types of analytics dashboards?
Now that we understand its importance, let’s explore the various types of analytics dashboards.
Sales dashboard
The sales analytics dashboard serves as a crucial tool for the sales team.
It provides important insights into the sales performance of a business.
It helps business owners monitor their sales activities, identify opportunities, and make data-driven decisions to boost revenue.
If you’re running a small business, understanding your sales data becomes even more critical for growth.
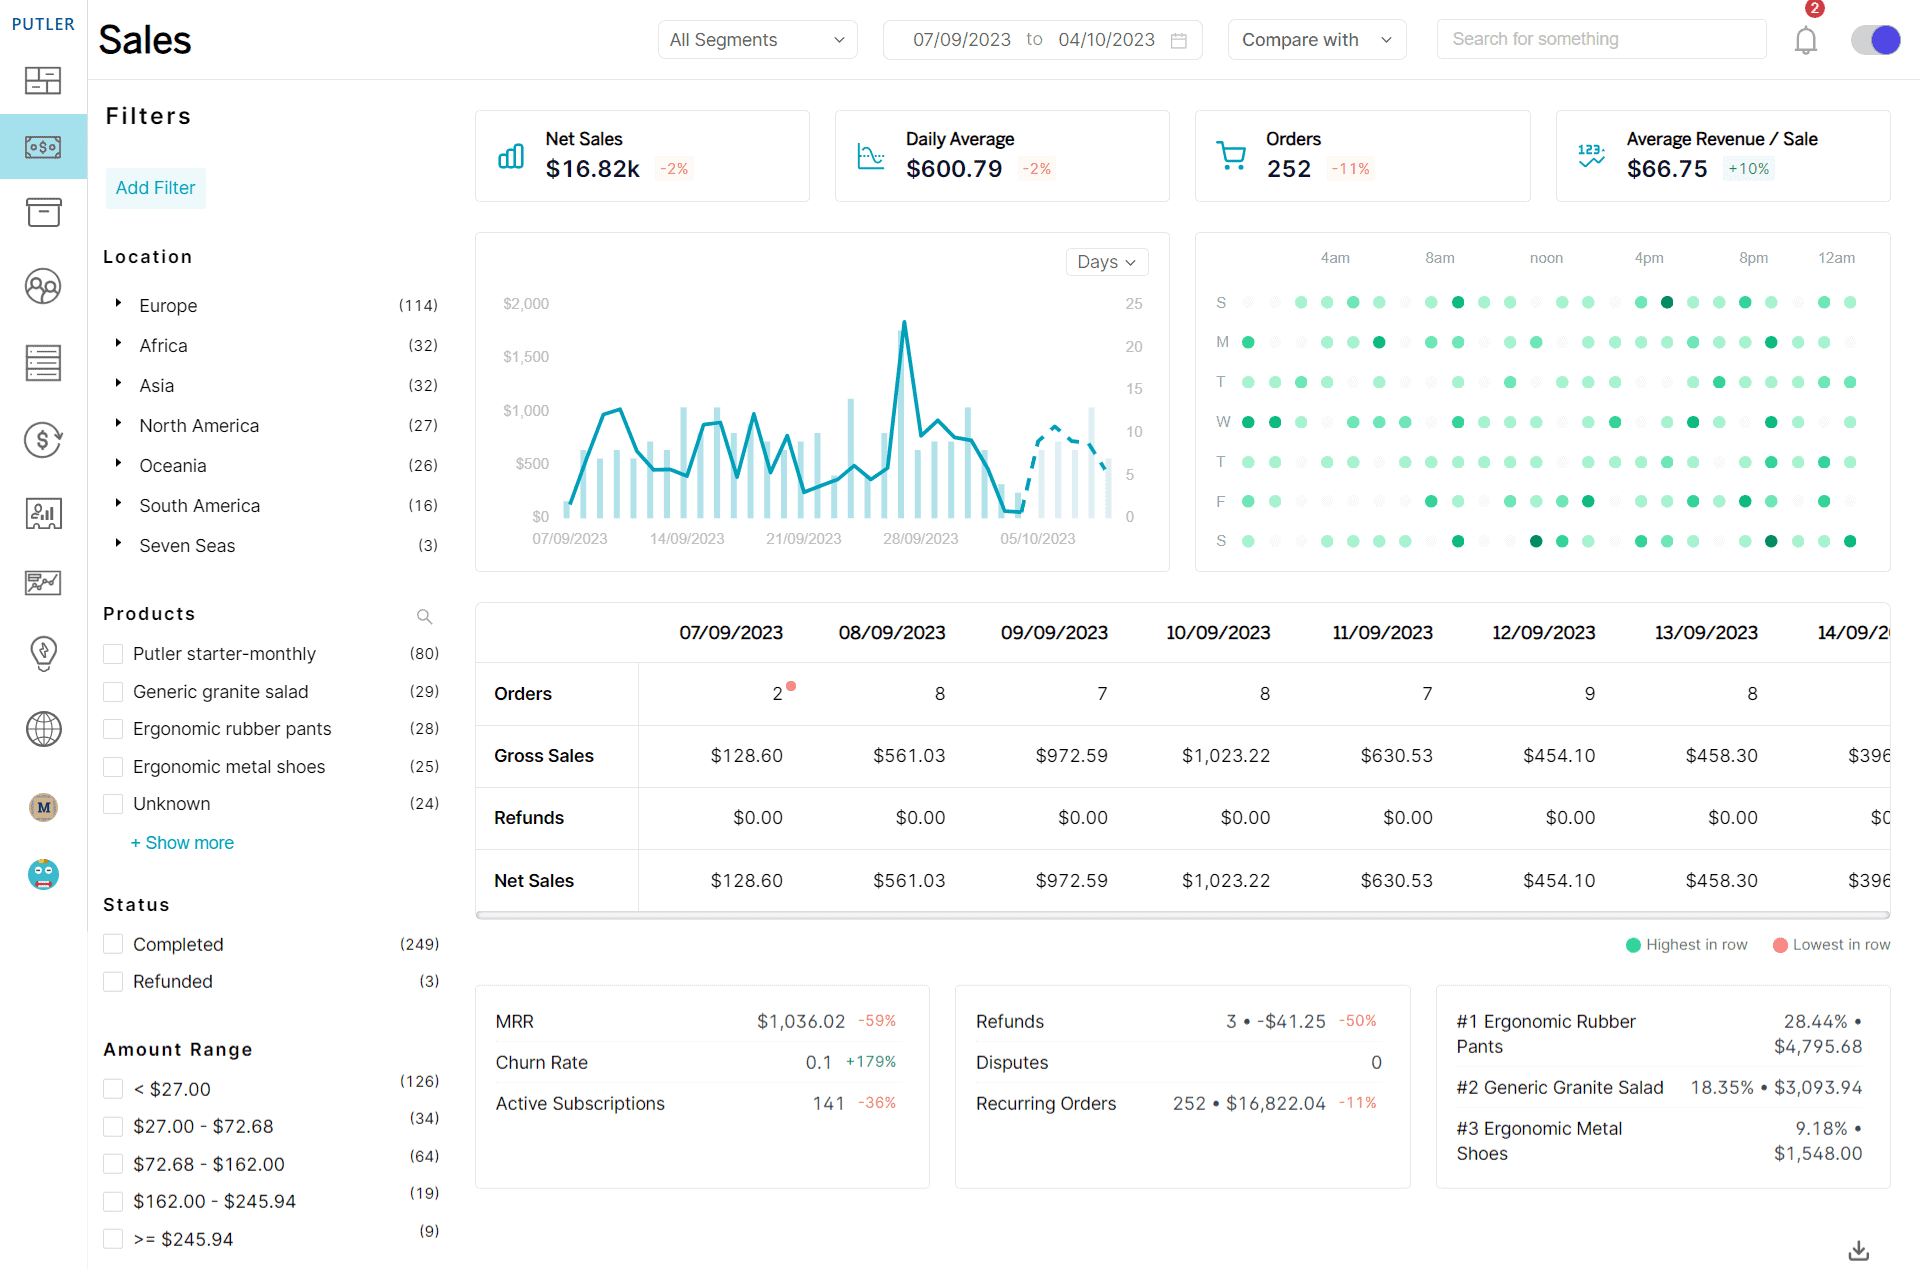
Putler provides business owners with an excellent sales analytics dashboard for managing their data.
Apart from that, it offers multiple dashboards for various aspects of your business, along with a business analytics dashboard, providing a comprehensive overview.
You can use Putler’s sales analytics dashboard to track your sales performance, monitor key metrics, and gain actionable insight into your business.
Another highlight of this dashboard is the Sales Heatmap. This feature helps you identify your sales performance in different periods.
You can use this information to find the best day and hour to launch new products or run sales campaigns for better performance and increased revenue.
In this dashboard you can find:
- Predefined filters
- Important sales metrics
- Sales chart
- Sales heatmap
- SaaS sales metrics
- Order List
- Sales breakdown chart
Web analytics dashboard
A web analytics dashboard provides you with a summary of how users interact with your website. It helps you to track, understand, and improve your online presence.
In this dashboard, you can find insight into your user behavior, traffic sources, and overall site effectiveness.
The sole purpose of this dashboard is to help businesses get a comprehensive picture of their website and optimize it for better user experience, improved engagement, and increased conversions.
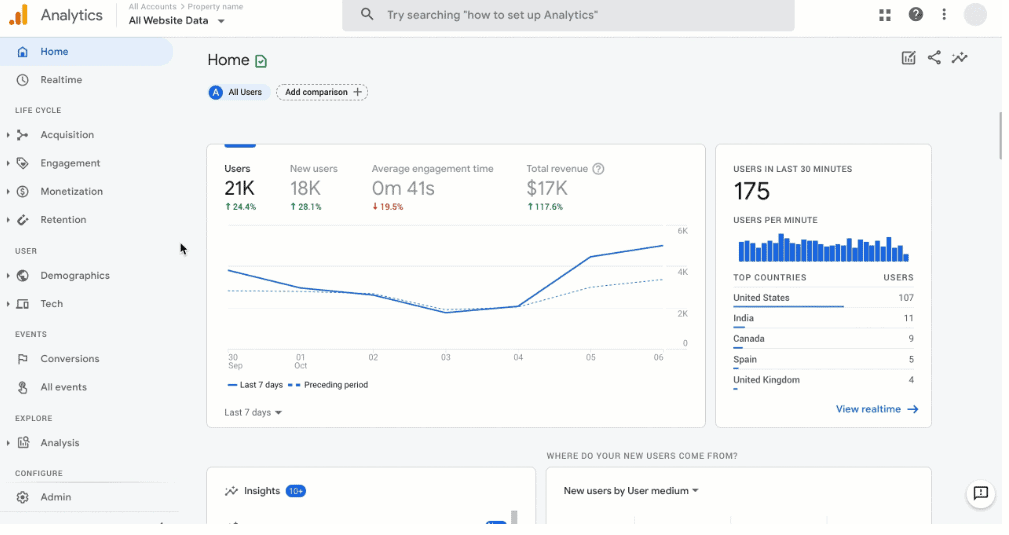
Google Analytics is the most popular web analytics dashboard. It helps you analyze your website performance and get detailed reports on user behavior, traffic sources, and other important metrics.
Google Analytics 4, or GA4, is the latest version of Google Web Analytics. It introduces a new data model that shifts from session-based tracking to event-based tracking, thereby providing more granular and flexible data collection.
While Google Analytics is the best tool for web analytics, you can still make it better with Putler.
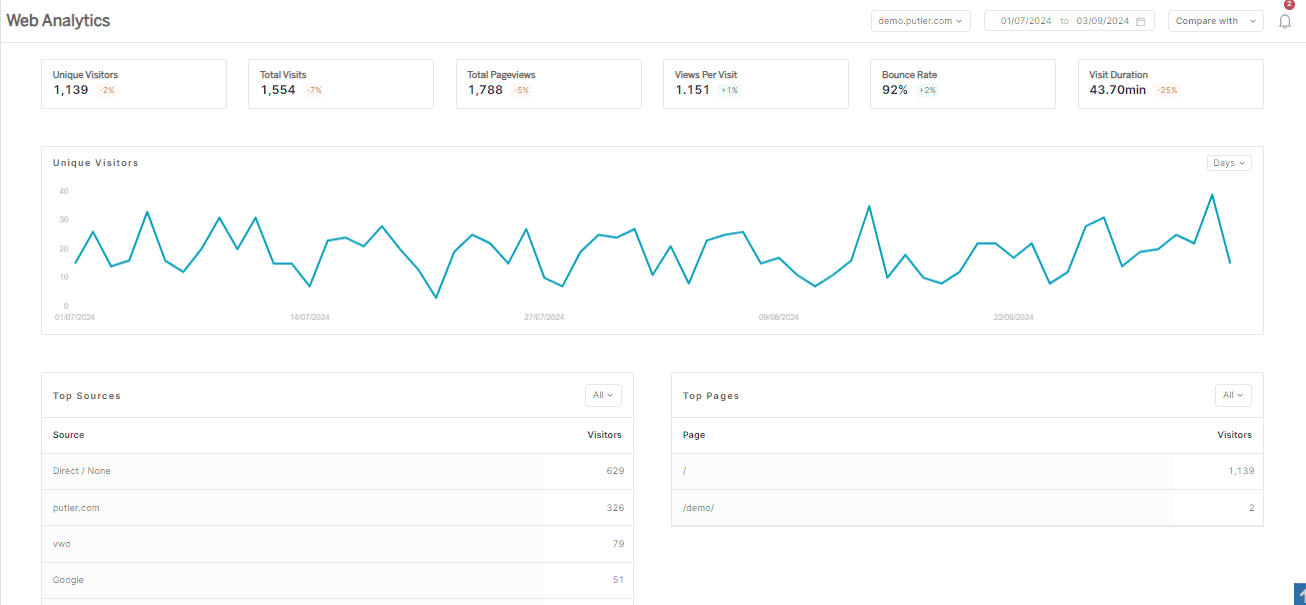
With Putler, you can get a comprehensive overview of your eCommerce business website.
It provides a centralized view of all key metrics, saving you the trouble of visiting multiple tools and pages.
Another highlight of Putler Web Analytics is that, unlike other tools, it values your privacy. You own your data, and there’s no leakage to third parties.
You can also combine the power of both by integrating Google Analytics with Putler. It will provide you with detailed and actionable insights about your eCommerce business.
It features dedicated dashboards for various aspects of your business, including sales, products, customers, and audience.
Product dashboard
As the name suggests, a product analytics dashboard is another important dashboard that helps you keep track of your products and their performance.
By monitoring these metrics, business owners can keep an eye on inventory levels, individual product performance, and stock turnover rates.
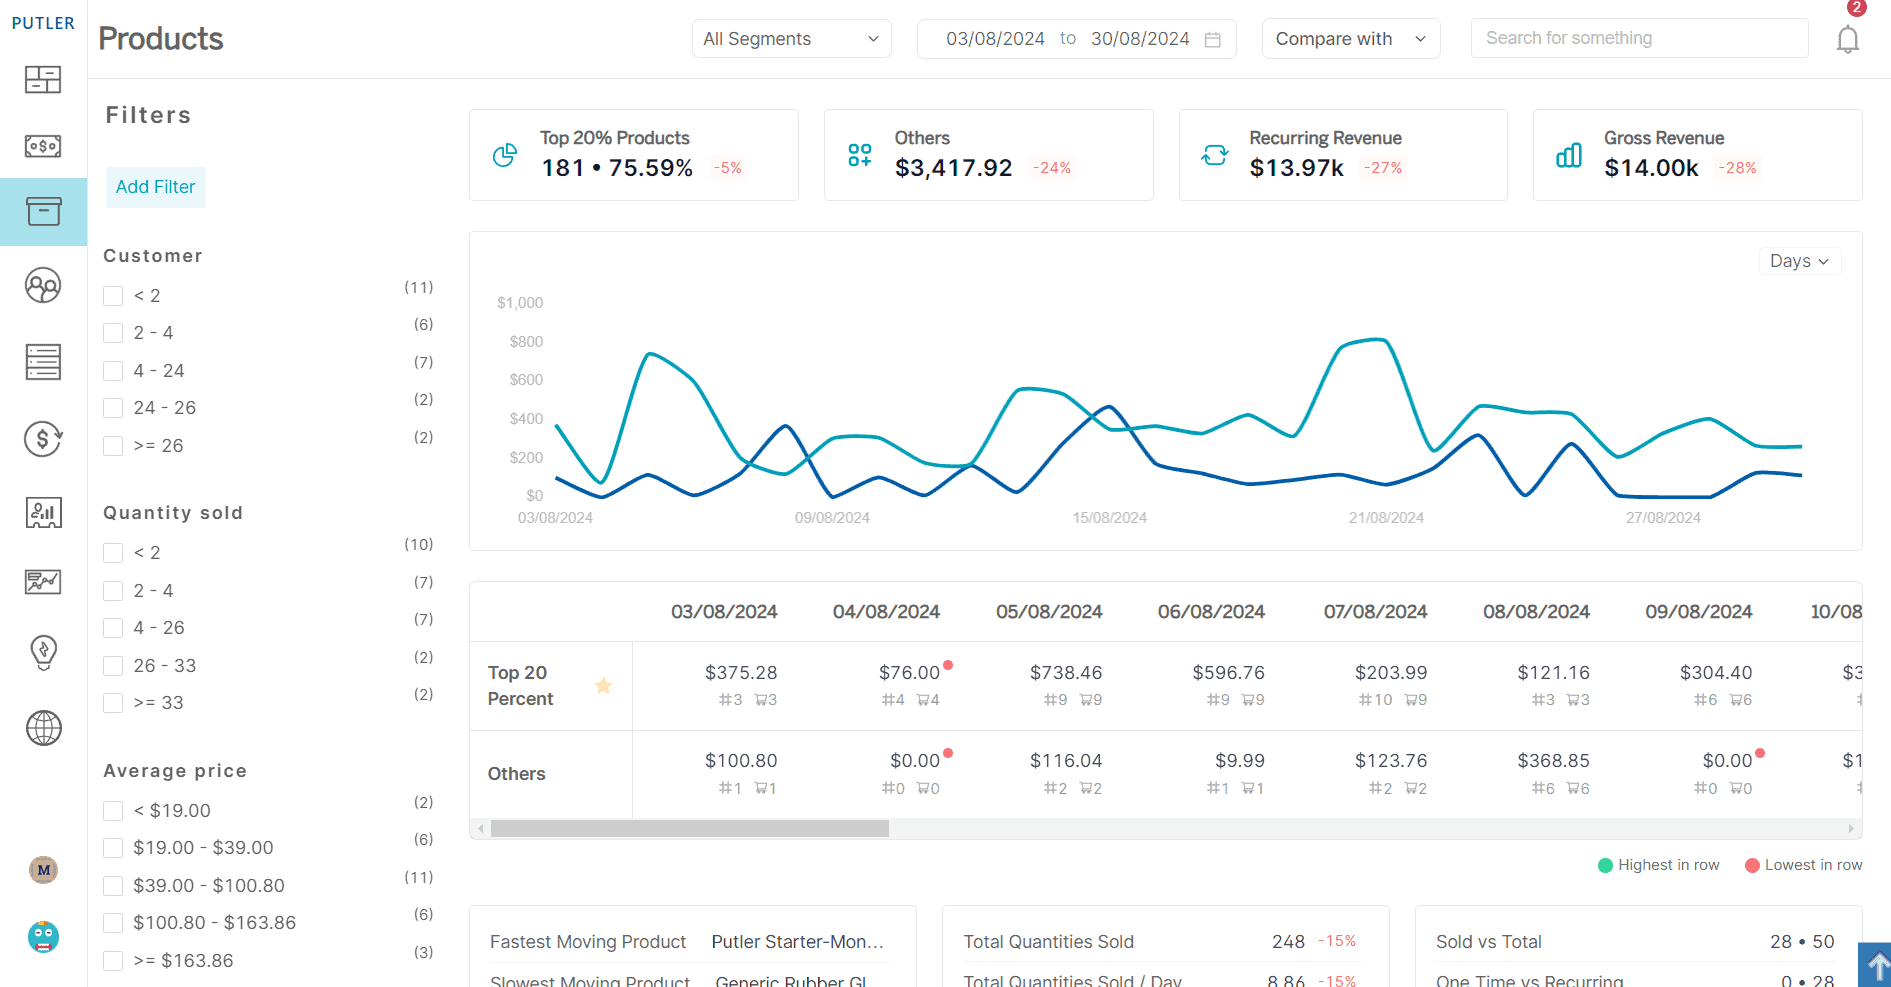
Putler’s product analytics dashboard provides quick insights into individual product performance along with an overview.
It helps you to:
- Track overall sales performance by product and category.
- Keep an eye on inventory levels using Putler’s product dashboard to check the sales history of a product to estimate how much inventory you must have in stock for upcoming months.
- Identify the fastest moving, slowest moving, top customer, highest refund product, etc.
- Uncover hidden product trends.
- Accurately forecast demand in the future with advanced analytics.
- Find important product metrics like top 20% products, best first purchases, highest refunded, fastest and slow-moving products, etc.
Here is the list of things you can find on the product dashboard:
- Predefined filters
- Product metrics
- Product breakdown chart
- Key product metrics (fastest-moving, slowest-moving product)
- Product list view
Customer dashboard
The customer analytics dashboard provides a comprehensive view of your customers’ in-depth information, behavior, and preferences.
It also helps you understand how customers interact with your business and their buying patterns.
Moreover, it helps find hidden customer trends or patterns that could help increase your sales.
You can use this information to improve your marketing efforts and customer experience.
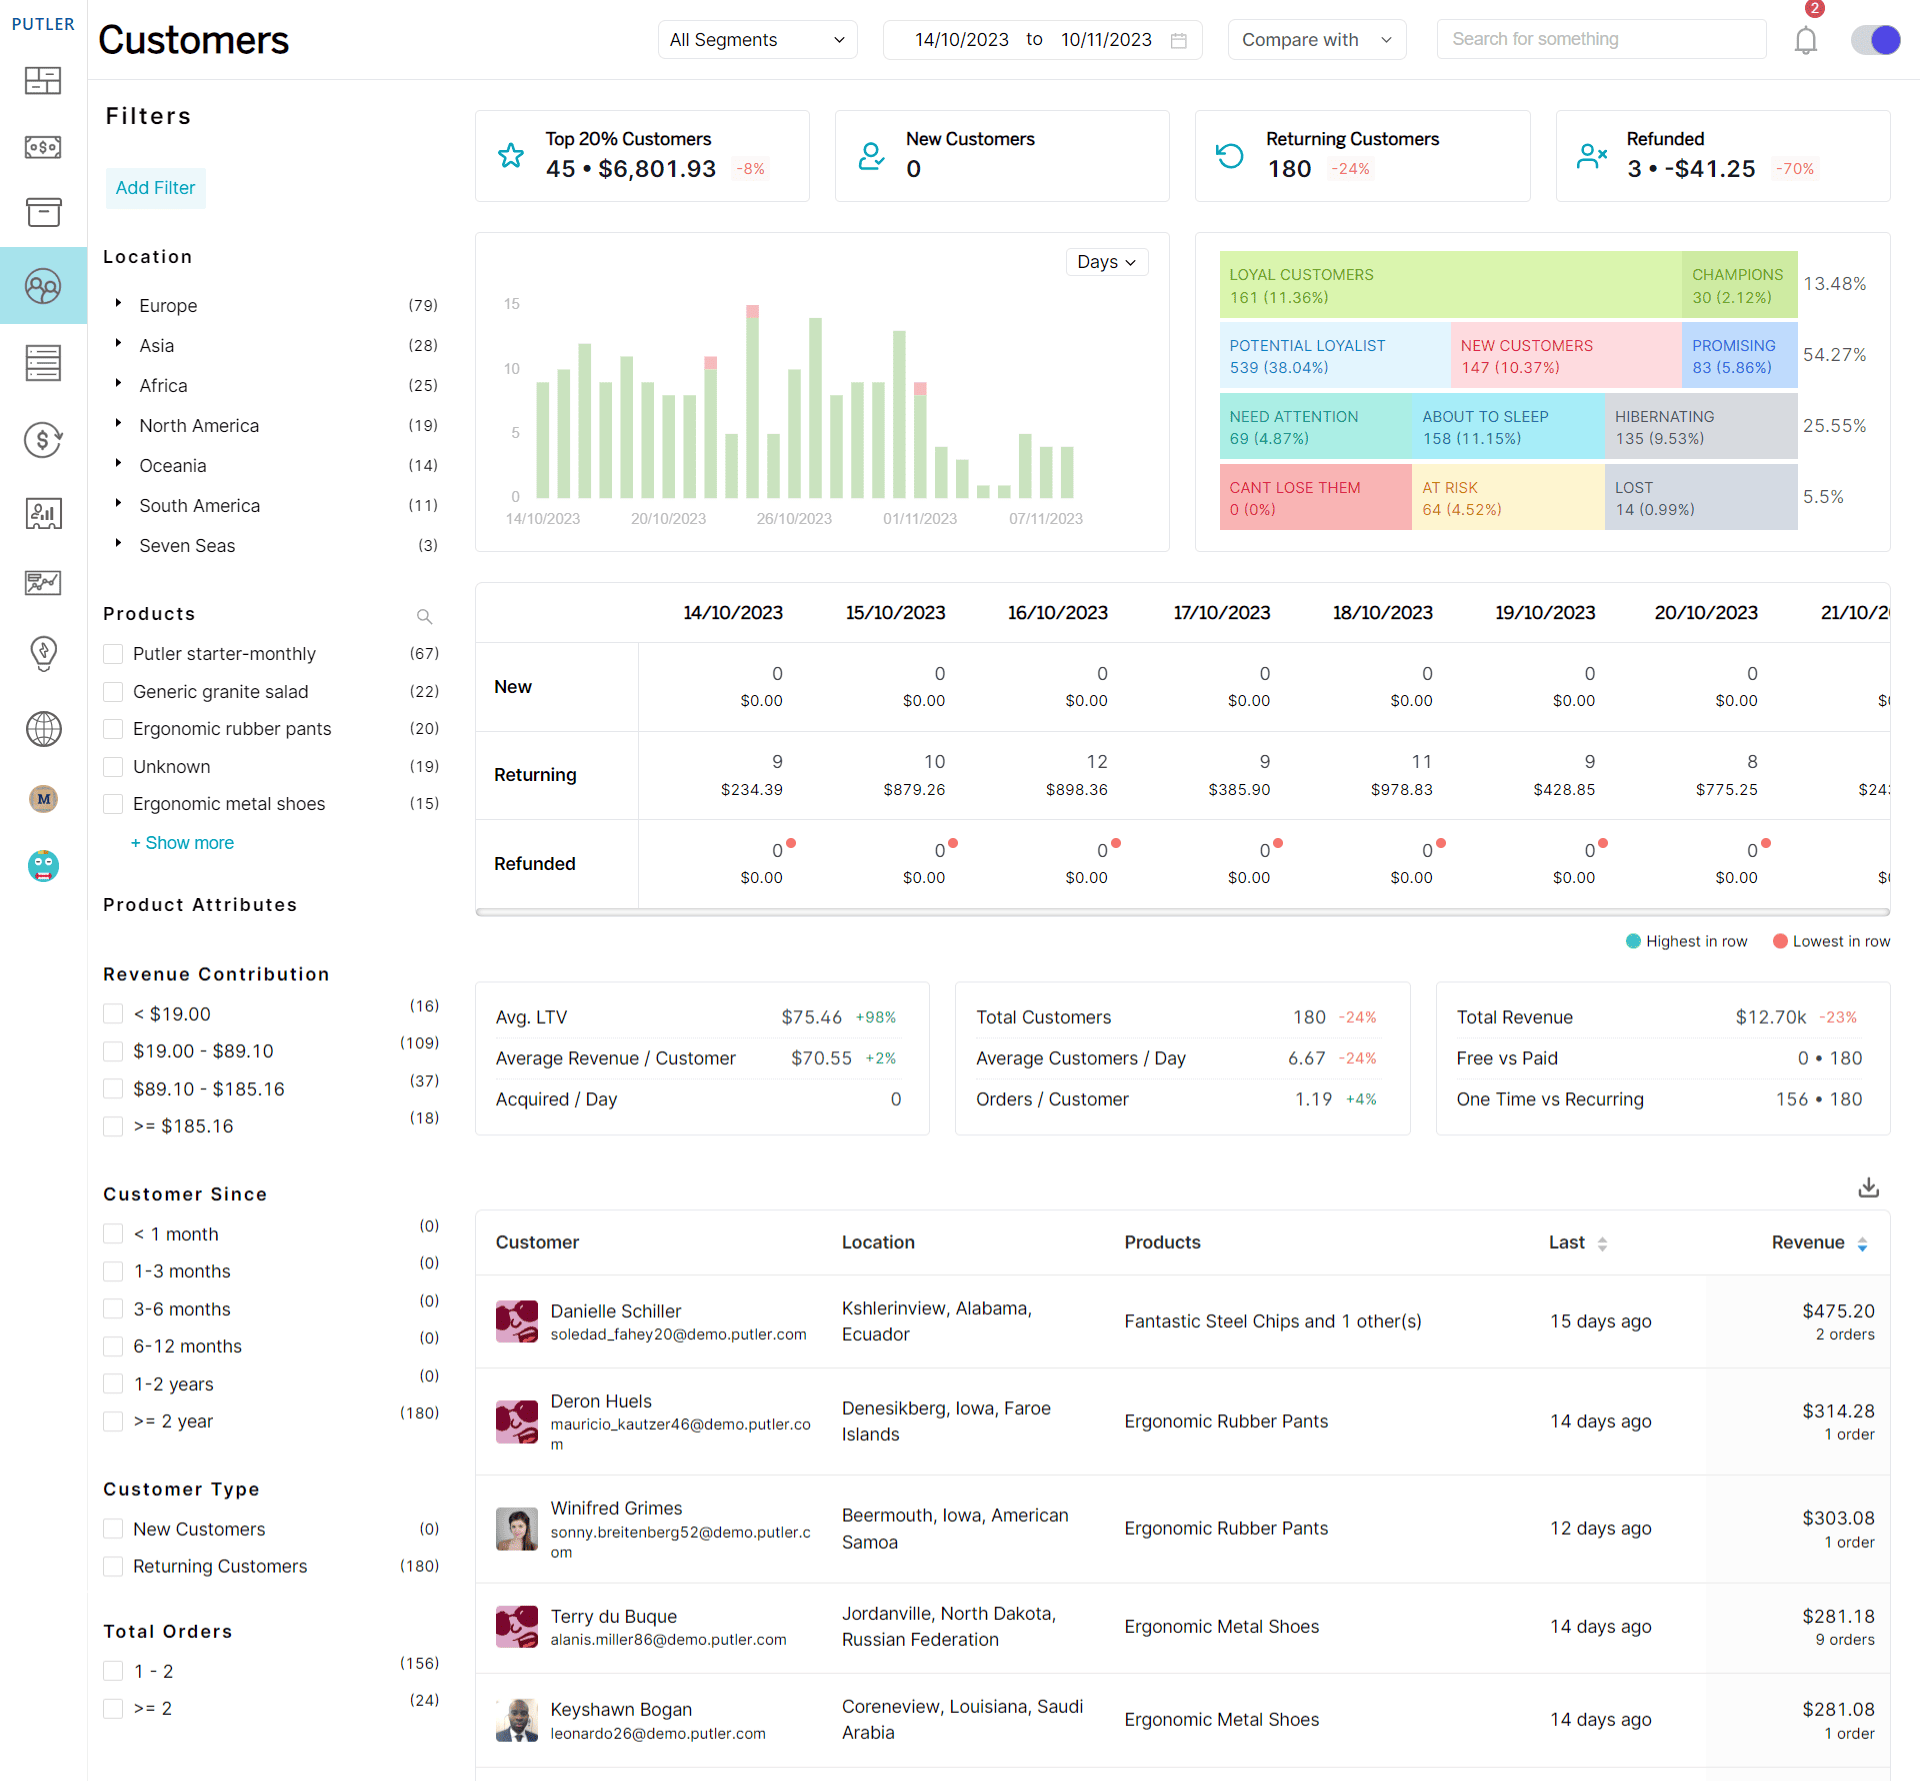
Putler’s customer analytics dashboard provides you with valuable insights into your customers.
Here, you can find important metrics as the number of unique purchasers, average lifetime value, top 20% customers, and the number of returning customers.
On the customer dashboard, you will also find RFM analysis.
It helps you segment your customers based on different criteria such as purchasing history, frequency, and monetary value.
You can use this to identify high-paying customers with RFM segmentation and customize your marketing strategy.
Additionally, this dashboard provides individual customer cards.
This helps you understand your customers better, including what they are like and what they appreciate about you.
SEO dashboard
The SEO dashboard is important for monitoring your website’s SEO performance.
This dashboard helps you see how your website performs in organic search engine results.
In such a dashboard, you can find everything related to your website’s performance, from keyword ranking, backlink profiles, organic traffic, and conversion rates.
Overall, it helps you to track, improve, and optimize your website’s visibility on search engines like Google.
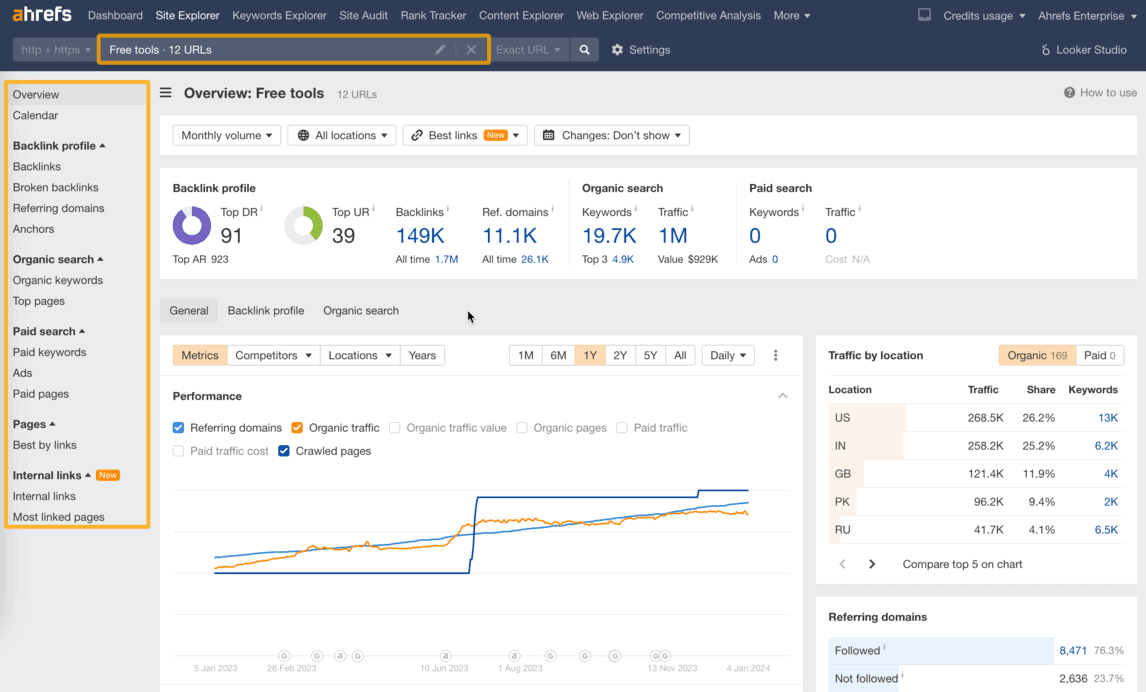
Ahrefs is a popular SEO analytics dashboard. It provides you with a comprehensive view of your keyword ranking, backlinks profile, and competitor analysis.
Here you can track your keyword performance on search engines and explore new opportunities to increase your website’s visibility.
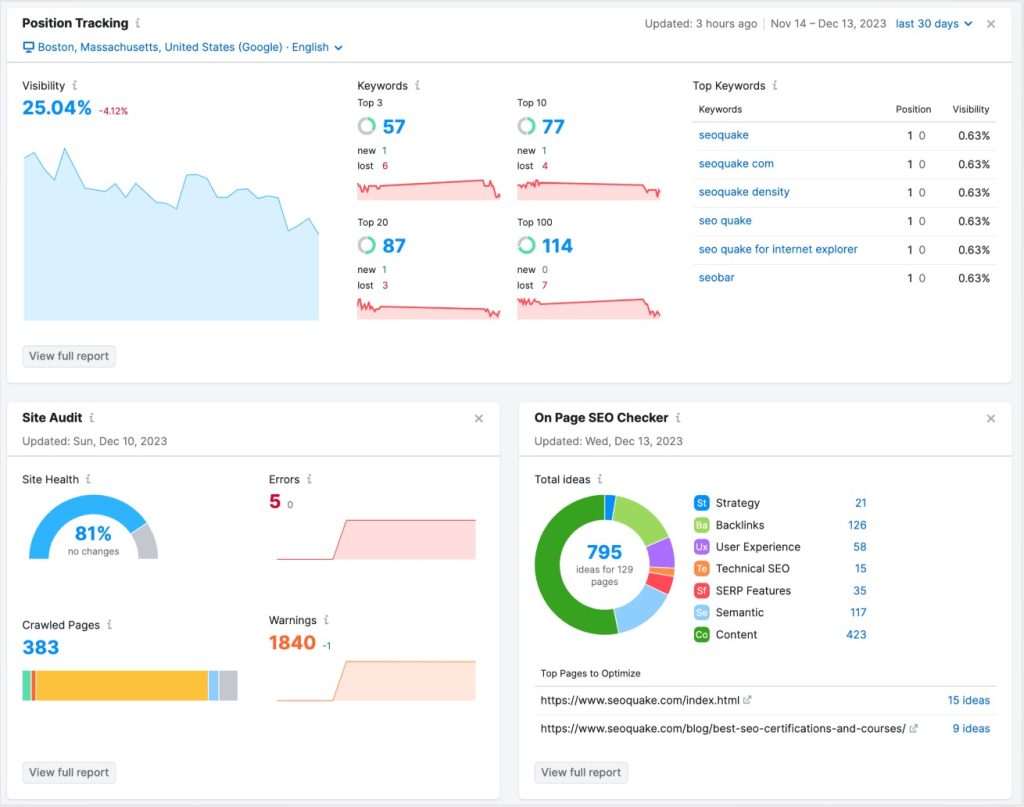
Semrush is another popular SEO dashboard. It provides almost similar features as Ahrefs.
It offers insights into your website’s organic performance, keyword rankings, and site audits. You can also view your website’s SEO performance and compare it to competitors.
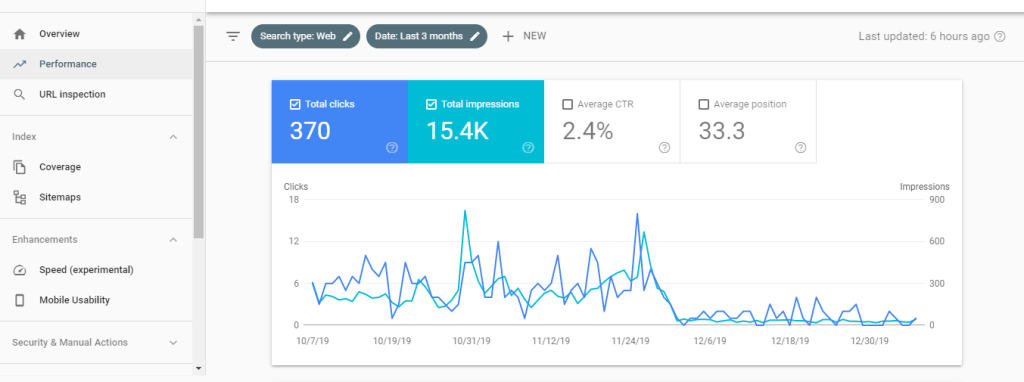
Google Search Console pulls data directly from Google and provides you with detailed information about your site’s performance.
It helps you identify critical issues affecting your site’s online performance and SEO. And the best part of this is that it’s completely free.
Social media dashboard
A social media dashboard helps you monitor your social media presence across various platforms.
It includes key metrics such as engagement, reach, follower growth, likes, and content performance.
It helps you refine your social media strategies and improve your online performance.
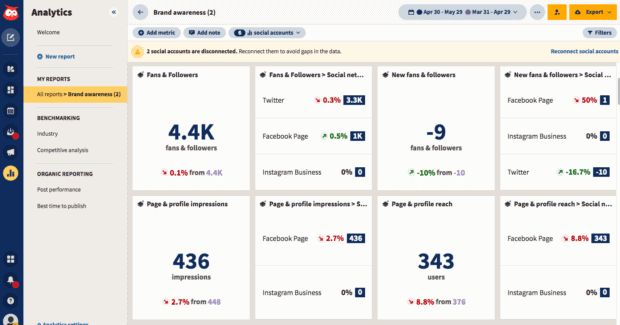
Hootsuite is a popular social media analytics dashboard. It allows you to manage and analyze your different social media accounts in one place.
You can use this tool to track your post engagement, schedule posts, and generate detailed reports on your social media performance.
Marketing performance
A marketing performance dashboard helps in understanding the effectiveness of your marketing campaigns. It tracks important metrics like conversion rates, ROIs, lead generation, and customer acquisition costs.
By analyzing these metrics, you can gauge the effectiveness of your marketing campaigns and improve them by making necessary changes.
Putler is an excellent tool for tracking your marketing campaign performances. It helps you to understand how well your customers are responding to your marketing efforts.
It tracks performance indicators like sales volume, revenue, and website metrics to determine the effectiveness of your marketing campaigns.
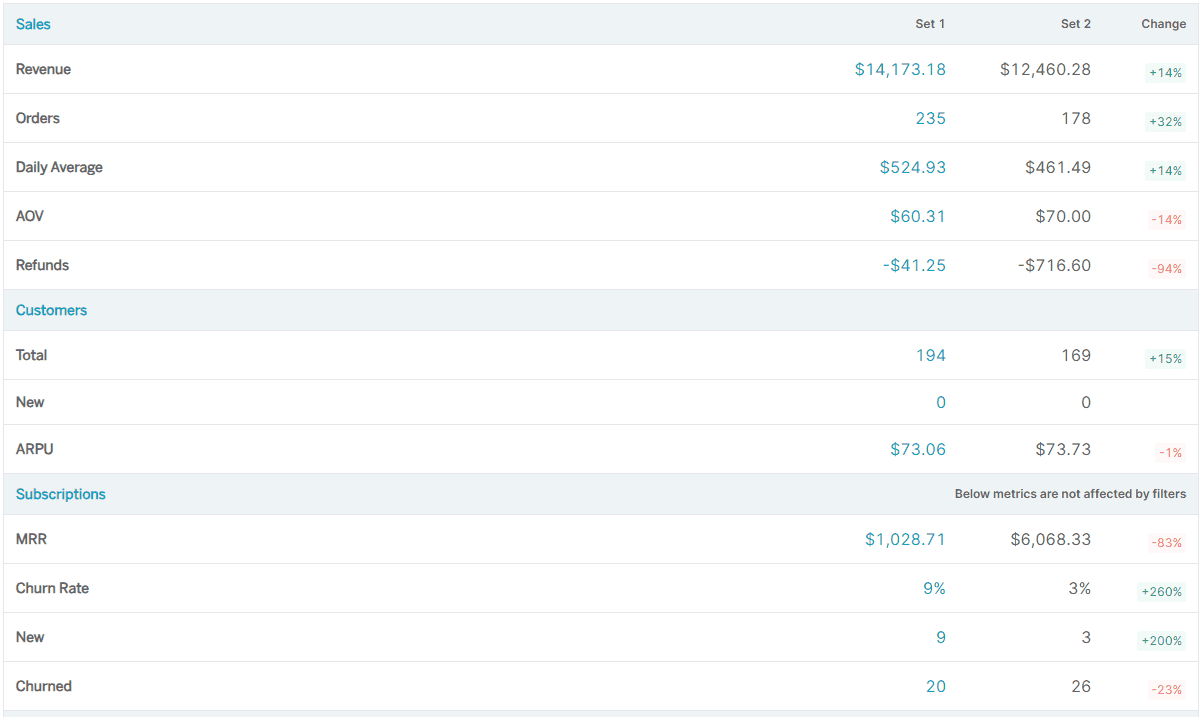
Another way to track your marketing campaign’s performance using Putler’s Insights dashboard is by identifying and analyzing purchase patterns and sales trends to drive revenue growth.
You can do this by comparing the dates when your marketing campaign ran to a timeframe prior to that.
You can also use this dashboard to compare the performances of two marketing campaigns and see which one was more effective.
Project management
A project management dashboard helps you track important metrics, stats, and insights about a particular project or strategy.
This dashboard is perfect for individual departments that are looking to monitor the success of their project or campaign. It helps them identify past sales and offer performance, enabling them to understand their effectiveness.
It also improves interdepartmental collaboration by providing transparency.
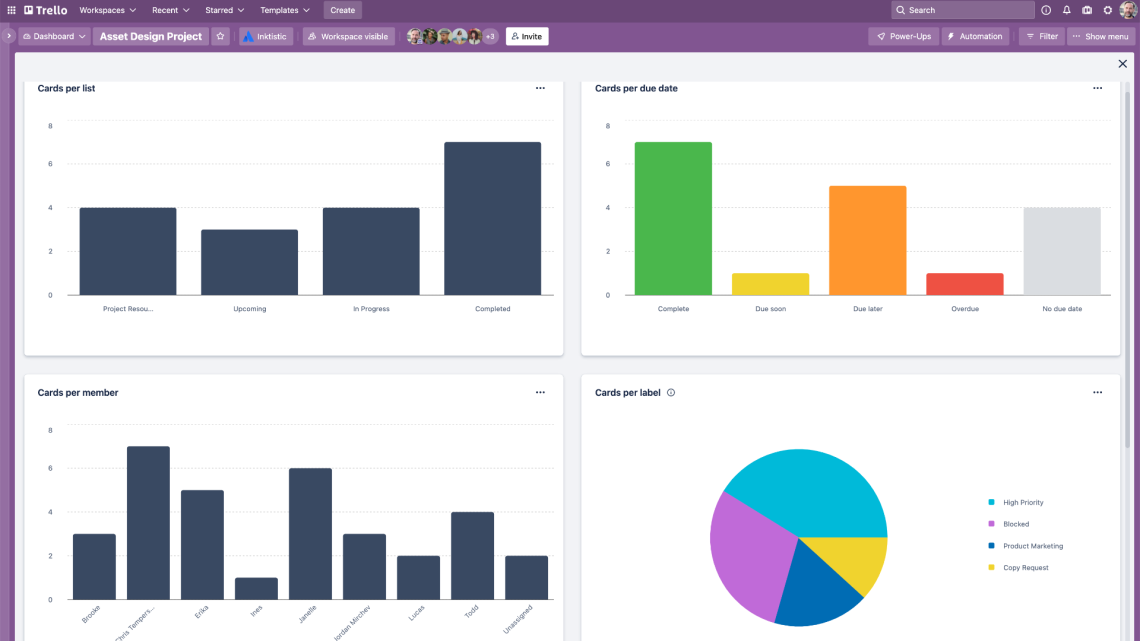
Trello offers a visual approach to project management. It uses boards, lists, and cards to organize and manage tasks.
Each board represents a project, the list represents the stage, and the card represents the individual tasks.
Users can move cards between the lists to show their progress. They can also add due dates, attach files, or leave comments.
The best part of Trello is its drag-and-drop feature. It makes it easy for to team to track progress and stay organized.
User journey
The user journey dashboard maps out the entire customer journey, right from initial contact to final conversions.
This analytics dashboard helps you understand how users interact with your website and identifies key touchpoints & potential drop-off areas.
Business owners can use these insights to optimize the entire customer journey and improve user experience and conversion rates.
Google Analytics provides a deep understanding of your user behavior.
It tracks important metrics, such as sessions, page views, and bounce rate, and also helps you set goals and create funnels to visualize user paths and identify potential drop-offs.
Additionally, Google Analytics provides deep insights into demographics, interests, and user flow to help you understand how your users navigate your website.
Key takeaway
An analytics dashboard is an important tool that helps you get actionable insights from your data.
Such dashboards convert complex information into an easy-to-understand form.
This helps in better decision-making and streamlining various facets of the business, including operations, marketing, and customer engagement.
And, if we talk about analytics dashboards, we certainly cannot miss Putler.
Loaded with advanced analytics capabilities, Putler stands out among its competitors as a great tool to enhance your business performance.
It consolidates data from different platforms into a unified dashboard to facilitate real-time decision-making and strategic planning.
You can try Putler right now to explore its capabilities firsthand.
FAQs
Q1. What is an analytics dashboard and how does it work?
An analytics dashboard is a centralized interface that visualizes key business metrics using graphs, charts, and tables. It pulls data from multiple sources to help businesses monitor performance and make faster, data-driven decisions.
Q2. Which types of analytics dashboards are most useful for eCommerce?
eCommerce businesses benefit most from sales dashboards, customer dashboards, product dashboards, and marketing performance dashboards. These help track revenue, customer behavior, product trends, and campaign ROI effectively.
Q3. How do analytics dashboards improve decision-making?
Dashboards provide real-time visibility into important KPIs, uncover hidden patterns, and reduce manual analysis. This enables faster, smarter decisions that are backed by accurate and actionable data.
Q4. What is the best analytics dashboard tool for small businesses in 2025?
Putler is one of the best analytics dashboard tools for small businesses in 2025. It offers real-time, multi-source data integration, pre-built dashboards for sales, customers, and products, and privacy-first analytics. These features help you make confident, data-backed decisions and scale your business effectively.
Q5. Can Google Analytics be integrated with other dashboards?
Yes. Google Analytics (including GA4) can be integrated with tools like Putler to combine website data with business metrics. This gives you a unified view of customer behavior and business performance in one place.