
Amazon has come a long way from selling books online. The company now sells nearly everything, and it holds around 40% of the US eCommerce market, far ahead of any competitor.
Along the way, Amazon has built out enough services that sellers can run the platform as their own eCommerce store. Learning to operate all of it takes time, and one of the most useful pieces is analytics, which Amazon does reasonably well.
If you’re building a store on Amazon and want to use its data to your advantage, this guide is for you. It covers what Amazon analytics is, the reports available, where they fall short, and how a dedicated tool fills the gaps.
What is Amazon analytics?
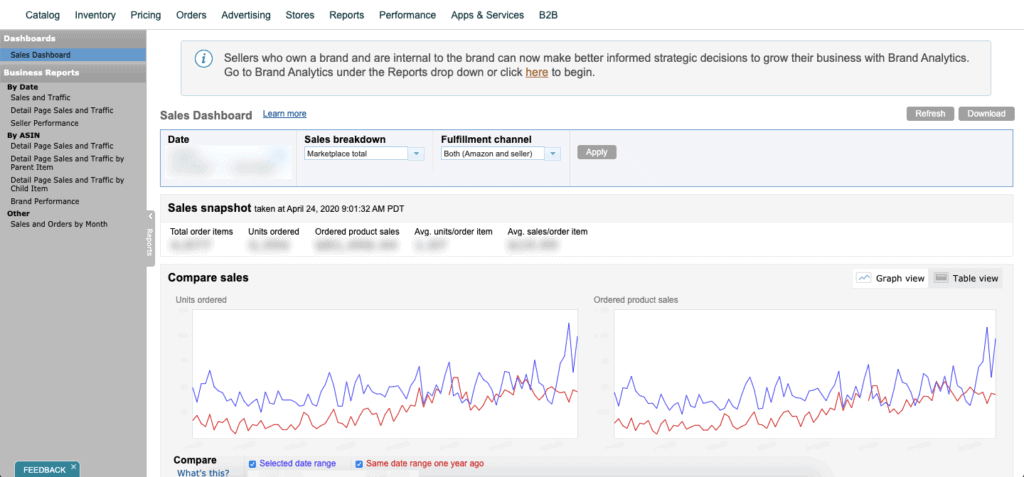
Amazon analytics is the set of services that reads, aggregates, and converts customer activity data into reports for the seller. In plain terms, it tells you what’s happening in your store, the way a good manager would.
That data gives sellers real insight into store performance: customer behavior, popular keywords, and even competitor activity. Access to this kind of factual data matters, because you can use it to make informed decisions about sales, advertising, and promotions.
One thing to keep in mind: Amazon provides its analytical reports only to members of the Amazon Brand Registry.
Why is Amazon analytics important?
Amazon analytics isn’t just a pile of numbers. Used well, it’s what guides a seller’s decisions.
Most sellers focus entirely on increasing sales and miss the bigger picture. In a competitive marketplace, knowing your business inside out, planning your strategy, and reaching customers the right way is what separates the sellers who thrive from the ones who stall.
That edge comes from insight into customers and their shopping behavior, combined with consolidated data on payments, sales, returns, orders, and settlements. Pair that with solid digital marketing and you have the foundation to become a top seller. To turn the insight into action, the guide on how to increase sales on the Amazon marketplace picks up from there.
Types of Amazon reports
There are several types of reports available on Seller Central and through Fulfilled By Amazon. Here’s a brief look at the important ones.
| Report | Description |
|---|---|
| Inventory Report | A full view of your inventory, including a summary of your product listings and their quantity. |
| Payment Reports | Lists all your transactions and payments in one place, including storage charges, settlements, reimbursements, and fees. |
| Business Reports | A complete overview of your business, covering performance, suppliers, stock, and incentives. |
| Sales Reports | Your daily, monthly, and yearly sales across orders and shipments. |
| Return Reports | An overview of pending and completed return requests from customers, organised by date. |
| Order Reports | The number of orders placed, cancelled, and shipped, along with each order’s summary. |
| Custom Reports | The Custom Reporting Platform lets a seller export any business report to CSV. |
| Amazon Search Terms Report | Shows the most popular terms searched on Amazon, helping sellers understand how customers find their products. |
| Item Comparison Report | Shows the top 5 products customers viewed frequently alongside competitor products. |
How Amazon analytics can positively impact your business
Amazon Business Analytics gives you insight into your organisation’s spending habits, which you can use to optimise purchasing decisions and find opportunities to improve. Here’s what it offers.
- Improved visibility into spend: See exactly where your organisation’s money is going and identify where you may be overspending.
- Optimised spend: Analysing spending patterns helps you cut waste and save money over time.
- Access to multiple reports: A range of reports gives you a full view of your spending habits.
- Save time: Automating data collection frees up time for other work.
- Gain insight: Spending-pattern insight helps you spot opportunities to improve and grow.
- Meet your goals: Set goals and track progress toward them, which keeps decisions focused and data-driven.
Amazon Business Analytics is a capable tool. But like any tool, it has limits that sellers run into.
Problems with Amazon reporting
Amazon analytics is a solid way to gain insight, but in a competitive market it isn’t enough on its own. The core issue: you get the same information every other Brand Registry seller has access to.
On top of that, there are gaps Amazon analytics doesn’t cover.
- Multi-store reporting: You only get reports on individual accounts, so tracking multiple stores gets difficult.
- Segmentation: You have to visit multiple sections for data on different features, which gets confusing fast.
- No insights: You get flat numbers. Analysing and interpreting them is left entirely to you.
- Basic customer data: The audience data is thin, so understanding your customers is hard.
- Export: Reports aren’t readily exportable. You have to request them from Amazon.
So where’s the competitive edge? To stand out with your data, you need a tool that turns raw Amazon data into insight you can act on.
Top metrics to track in Amazon analytics
A tool that makes the most of your data is only useful if you know which metrics matter. Here are the ones worth watching.
- Advertising Cost of Sales (ACoS): Shows how much you spend on advertising relative to revenue. Keeping ACoS under control means your ad spend actually drives sales instead of leaking money.
- Average Order Value (AOV): How much customers spend per order. Raising AOV grows revenue without needing more customers.
- Break-even ACoS: The ACoS you need to break even on ad spend. Stay below it and your ads are profitable.
- Click-through rate (CTR): How often people click your ads. A good signal of how well your ads land with your audience, and where ad copy can improve.
- Conversions: How many people take a desired action, like buying or signing up. Optimising listings and product info lifts this and drives more sales.
Tracking these lets you make data-driven decisions to optimise campaigns, increase sales, and improve profitability. With the right tool, collecting and analysing this data turns it into insight you can act on. It also helps to know how to find best-selling products on Amazon so you’re tracking the right listings in the first place.
Third-party reporting tools for Amazon
Several Amazon analytics tools offer more detailed reporting, including AMZ Tracker, SellerBoard, DataHawk, and Priceblink. The roundup of Amazon analytics tools covers them in depth.
Putler has it all, and more
What does Putler give you that Amazon analytics doesn’t? Marketing insight. Putler is more than a data-aggregating tool, and here’s what sets it apart.
Data aggregation
Putler aggregates all your Amazon data into a single dashboard as charts, graphs, and insights. You can track single or multiple stores and multiple payment gateways, with automatic currency exchange across time zones and payment accounts.
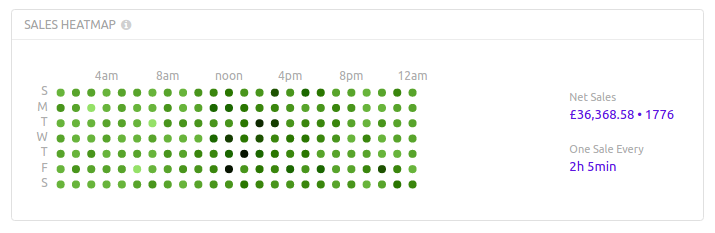
You can view aggregated data for overall performance or dig into individual data for customer behavior. Putler also reads the data and surfaces gaps and opportunities through a Sales Heat Map.
Detailed reports
Putler aggregates data into standalone reports covering sales, orders, products, customers, audience activity, subscriptions, payments, and transactions. From best-performing products to customer interests, it covers the range. If you’d rather pull the raw record, here’s how to export Amazon orders cleanly.
Useful insights
The real value is in the insight. Putler surfaces gaps and opportunities: for example, frequently-bought-together products you could bundle into a combo offer to lift sales.
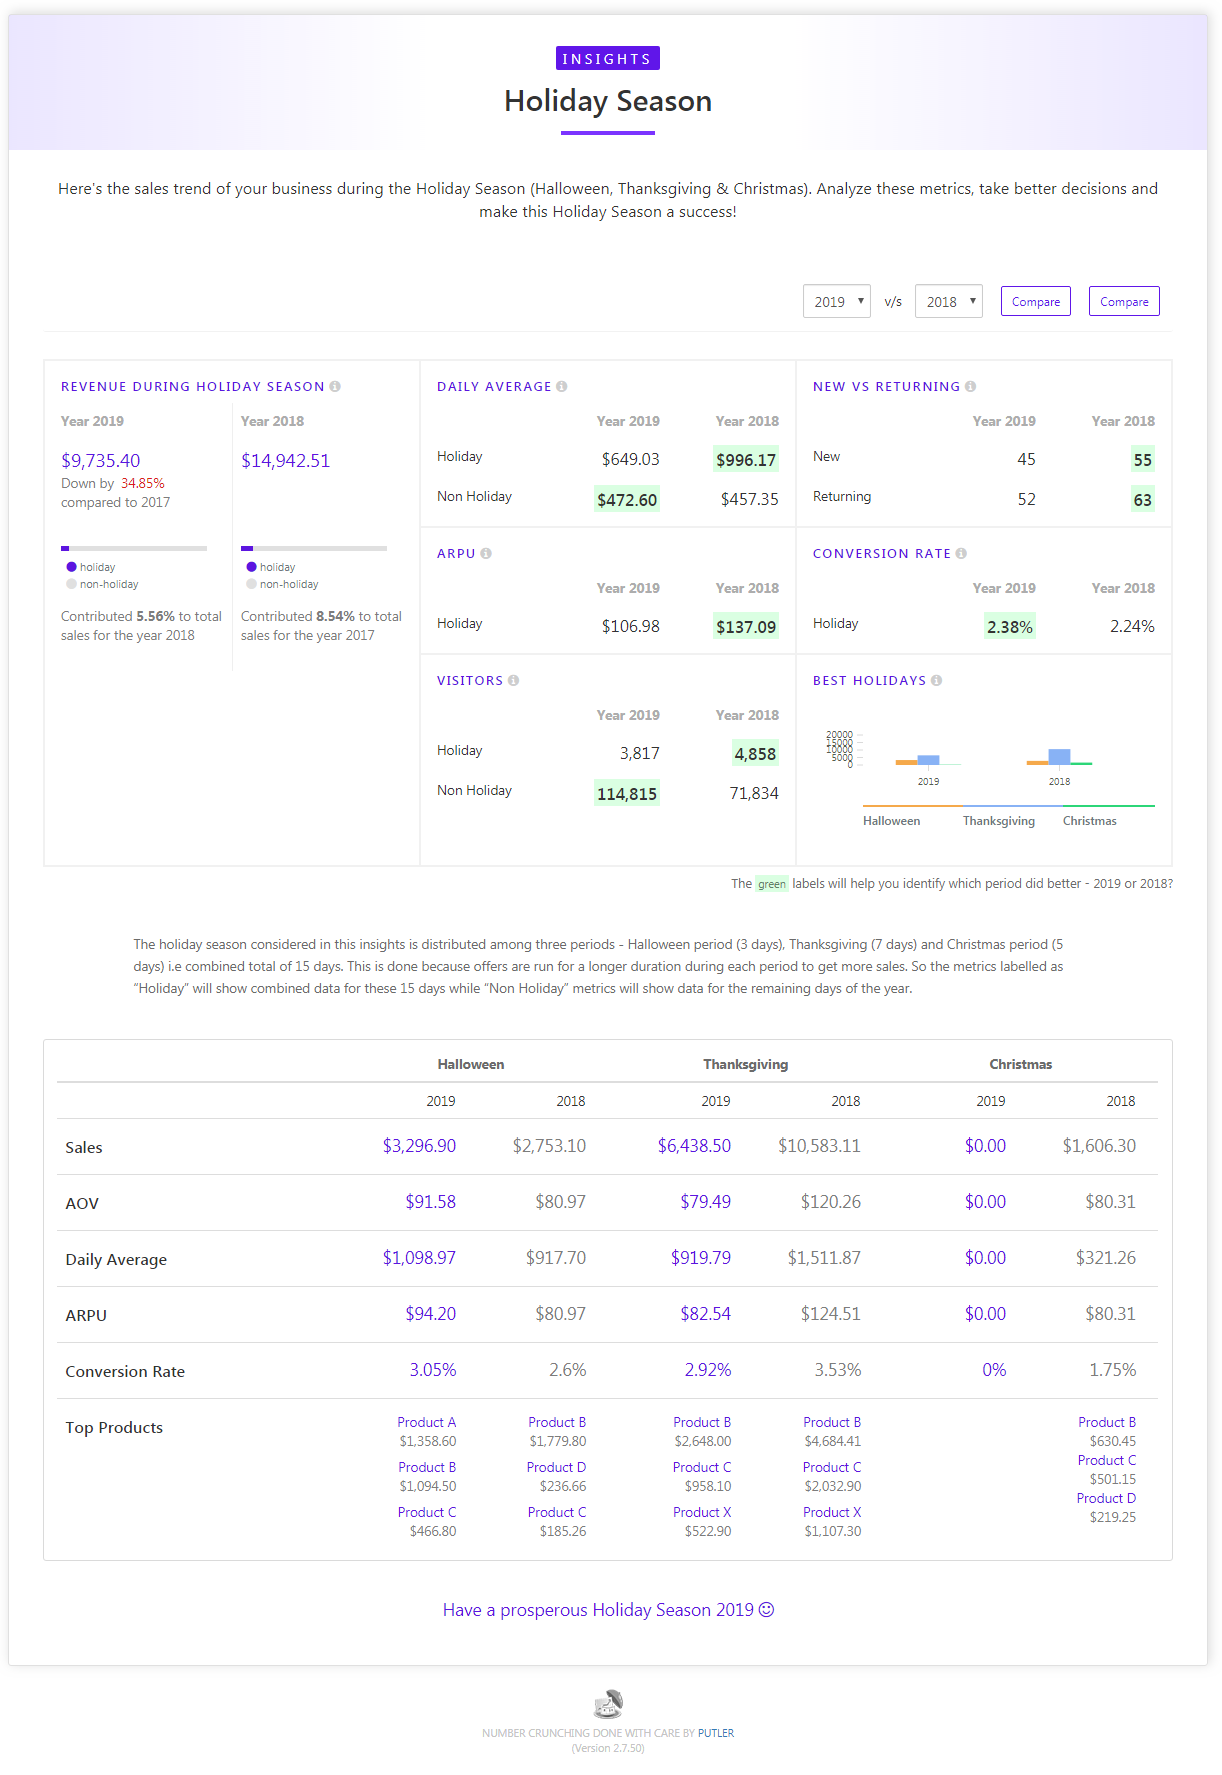
You can also review revenue during holiday seasons and see which products were popular, so you can remarket them next time around. Putler reads your current sales trends and forecasts your next month’s revenue, and its pricing insights show the price range that attracts the most customers so you can price accordingly. None of this is available on Amazon.
Customization
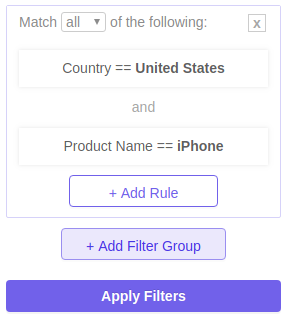
Want a specific slice of a large data set? Putler’s customization handles it. Create segments and split data using ready-made filters, or build your own.
For example, use the compare feature to measure one time period against another, or filter aggregated data by time period, specific day, date range, or individual customer.
Customer segmentation
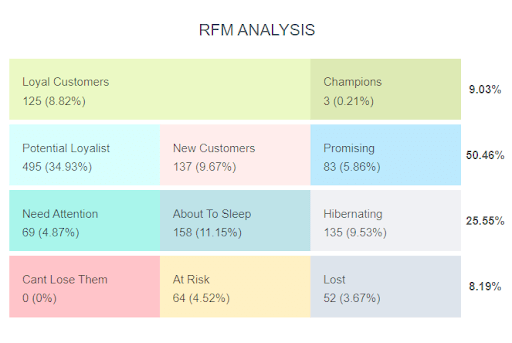
Sales depend on how well you know your audience: who they are, where they’re from, and what they like. Amazon’s limited data doesn’t give you enough to work with, so Putler includes customer segmentation based on recency, frequency, and monetary value among other filters.
There’s more
Alongside the above, you also get:
- SaaS metrics like ARR, MRR, customer lifetime value, and churn rate
- Multi-store reporting, and if you run several Amazon stores, a guide to managing multiple Amazon accounts
- An easy-to-understand interface
- Email alerts about weekly performance
- Ready-to-use filters and quick search
- Unlimited export to CSV
Still deciding? The live demo is a good place to look. And if you’re weighing Amazon against other marketplaces before you commit, the Amazon vs eBay and Amazon vs Shopify comparisons lay out the trade-offs.
Final thoughts
Amazon plus analytics is a real driver of eCommerce success. With the right tools you can boost sales and build a brand of your own.
Amazon’s native analytics is a decent starting point, but real growth needs deeper insight, long-term trends, and reports you can act on. That’s the gap Putler fills, whether you run a single Amazon store or several. Try it and see what your data looks like once it’s all in one view.
FAQs
What are Amazon seller analytics tools?
Amazon seller analytics tools are software that simplify selling on Amazon and provide accurate results, whether your business is big or small, new or established. The hard part is managing everything at once, especially for larger sellers, and that’s where Amazon seller analytics tools help.
Why do you need analytical tools?
With Amazon analytics, you can gauge how your business is doing now and where it’s likely heading, so you can plan around growth or catch a decline early.
What is the best analytics tool for Amazon sellers?
There are many analytics tools on the market. For sales and profit analytics specifically, the recommended tools are laid out here, along with what each does best.
- Best Amazon Analytics Tools
- How to read your Amazon order history report
- Marketing Analytics: Everything you need to know