
This Baremetrics review is updated with the latest features, integrations, and pricing details. If you’re exploring analytics tools for your SaaS or eCommerce business, this guide will help you compare Baremetrics vs Putler and decide which one is right for you.
Why do Businesses Need Analytics Tools?
Running an online business means dealing with tons of complex data. Managing it manually often results in errors, wasted time, and missed opportunities. That’s where business intelligence tools step in — they automate reporting, improve accuracy, and give you insights that actually drive growth.
Among the many analytics tools out there, Baremetrics and Putler are two popular choices. But they serve different needs — let’s begin with how they handle metrics.
Metrics: SaaS-Only vs. All Business Metrics
Baremetrics is built mainly for SaaS companies. It tracks subscription metrics such as:
- MRR (Monthly Recurring Revenue)
- ARR (Annual Recurring Revenue)
- Churn rate
- LTV (Customer Lifetime Value)
- ARPU (Average Revenue Per User)
Baremetrics is great if your entire business revolves around subscriptions. But if you’re running eCommerce, agencies, or multi-channel stores, it quickly shows its limits.
On the other hand, Putler is useful for not only subscriptions businesses but also other online businesses which are not into subscriptions. These include all kind of online stores, startups, accountants, etc. It covers all key aspects of a business:
- SaaS metrics (MRR, churn, LTV, etc.)
- eCommerce metrics (sales trends, product performance, customer insights)
- Financial metrics (cash flow, refunds, revenue forecasting)
- Customer analytics (segmentation, geography, cohorts, behavior)
- Personalized insights (sales heatmap, products bought together, RFM analysis)
This makes Putler equally valuable for SaaS, eCommerce, agencies, and even businesses running multiple online stores.
Integrations: Limited vs. Flexible
Baremetrics – Focused on SaaS Insights
Baremetrics now integrates with Stripe, Shopify, Braintree, Google Play Store, Apple App Store, QuickBooks, Xero, Chargebee, and Recurly.
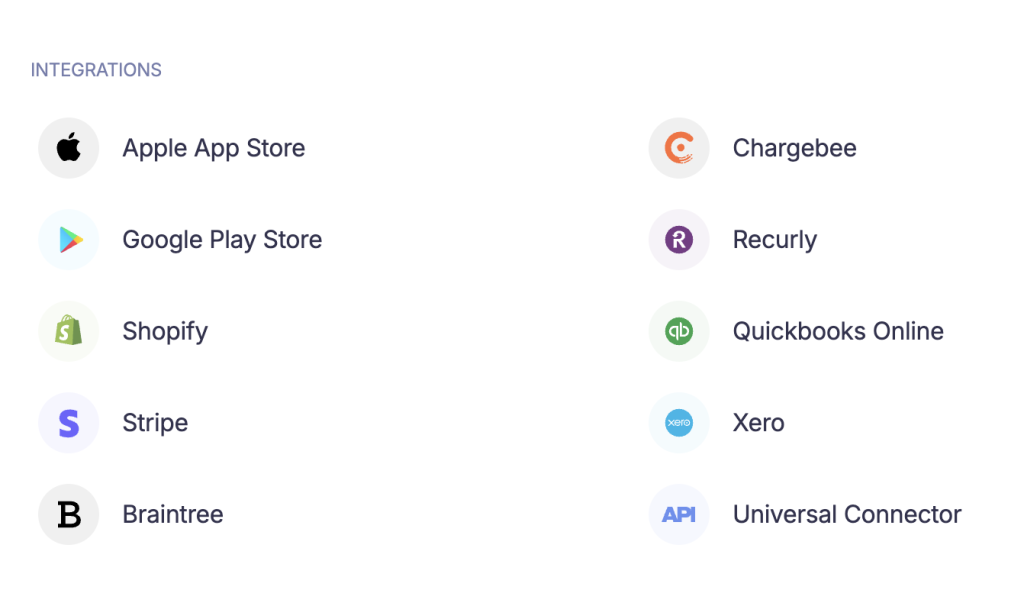
This makes it a solid choice for SaaS and subscription-based businesses, as well as mobile app developers.
However, it still does not provide direct integrations with PayPal, WooCommerce, Amazon, Etsy, and other multi-channel platforms, which limits its usefulness for merchants running diverse eCommerce operations.
In addition to integrations, Baremetrics is optimized for subscription businesses and now offers features like:
- SaaS dashboards with real-time subscription metrics (MRR, ARR, churn, LTV)
- Revenue forecasts for traffic and customer growth
- Payment recovery via dunning (Recover add-on)
- Subscription cohorts and benchmarks to compare performance
Note: Always validate pricing and feature availability directly on Baremetrics’ pricing pages to stay current.
Putler – All-in-One, Multi-Channel Analytics
Putler brings an enriched analytics experience by combining, cleaning, and enriching data across platforms – what they call an aggregated “single source of truth.”
Here are the confirmed standout features:
- Data Cleanup, Deduping & Consolidation: Automatically resolves mismatches, sync inconsistencies, duplicate entries, and more across carts, gateways, and Google Analytics.
- Automatic Currency Conversion: Supports 36 currencies, uses real exchange rates, and converts transactions into your selected base currency for seamless financial reporting.
- Multi-Platform Integrations & Multi-Store Management: Consolidates data from PayPal, Stripe, WooCommerce, Shopify, eBay, and others into one dashboard-making it ideal for multi-channel sellers and agencies.
- Rich eCommerce & Customer Analytics: Features include:
- 200+ metrics across sales, refunds, orders, and subscription KPIs
- Product insights (leaderboards, variation trends), visitor analytics, segmentation, and RFM (Recency–Frequency–Monetary) analysis—generating 11 customer segments like “Champions,” “Loyal,” “At-risk,” etc.
- Email Reports, Team Sharing, Forecasts, and Goals: Send weekly email summaries, set growth goals, export data, and collaborate with team members—all via intuitive built-in workflows.
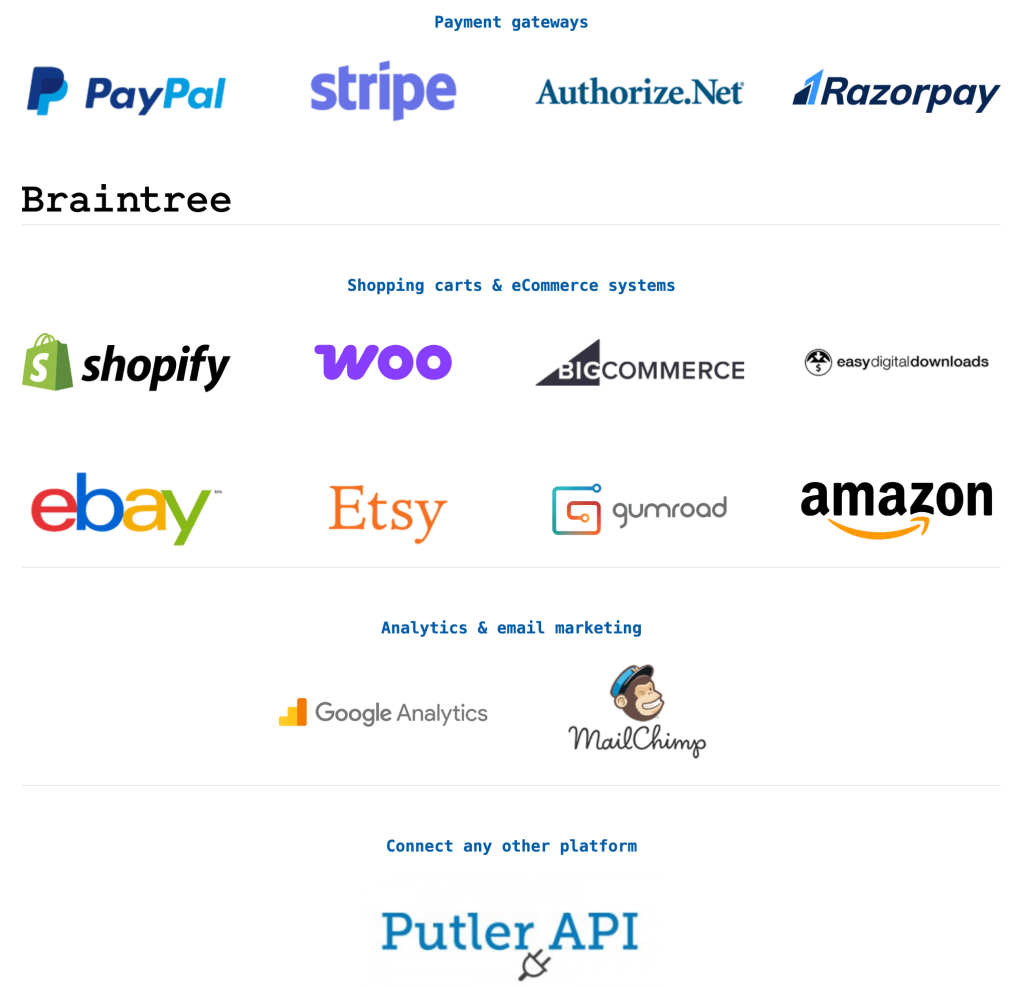
In addition, Putler’s Inbound API enables you to connect to other services not mentioned above. Get all business metrics and reports by connecting any of your preferred ones easily with Putler.
Key Features & Benefits
When evaluating analytics tools, it’s not just about pretty dashboards – it’s about whether the features actually help you run your business better. From handling data across multiple platforms to managing currencies, forecasting revenue, and segmenting customers, each feature plays a role in giving you accurate, actionable insights.
Let’s walk through the most important features and see how Baremetrics stacks up against Putler.
Consolidation & Deduping
Businesses today often rely on multiple platforms – Shopify, PayPal, Stripe, WooCommerce, or marketplaces like Etsy and Amazon. That means your data is scattered. Looking at just one source gives you an incomplete picture, while combining them manually can lead to messy duplicates. That’s why consolidation and deduping are must-have features in any analytics tool.
- Baremetrics: Allows you to connect multiple data sources, but only shows combined results. You can’t analyze performance by each individual source, and duplicate entries can sometimes inflate totals.
- Putler: Goes a step further. It provides both combined and individual reports (e.g., PayPal-only or Shopify-only) and automatically deduplicates transactions, so your numbers remain accurate and reliable.
Currency Conversion
If your business sells internationally, revenue isn’t just coming in one currency. Customers might pay in USD, EUR, GBP, or dozens of other currencies. Without proper conversion, your reports can become misleading — a €100 sale and a $100 sale aren’t the same in value. A good analytics tool needs to handle multi-currency transactions correctly.
- Baremetrics: Provides support for multiple currencies but converts everything into a single base currency for reporting. While this gives a unified view, it may not reflect the true picture if you want to analyze revenue in original transaction currencies.
- Putler: On the other hand, Putler supports multiple currencies and automatically converts them to give you a global, single-currency dashboard. Be it dollars, euros, pounds, or rupees. It automatically takes care of currency conversions and ensures you always see accurate consolidated reports.
Analytics & Reporting
Baremetrics Reporting & Analytics
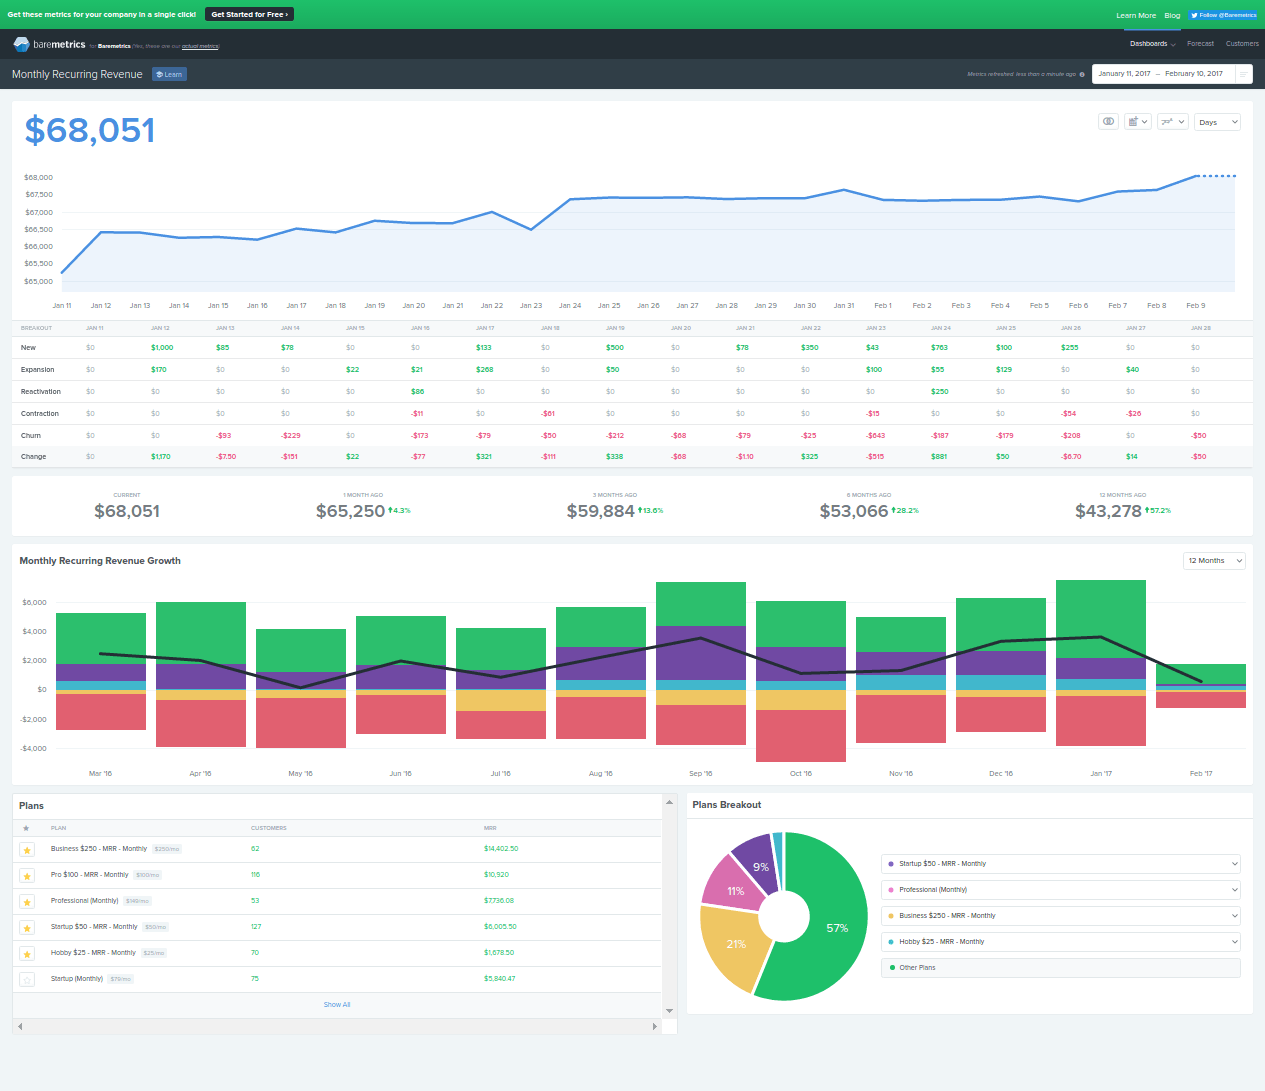
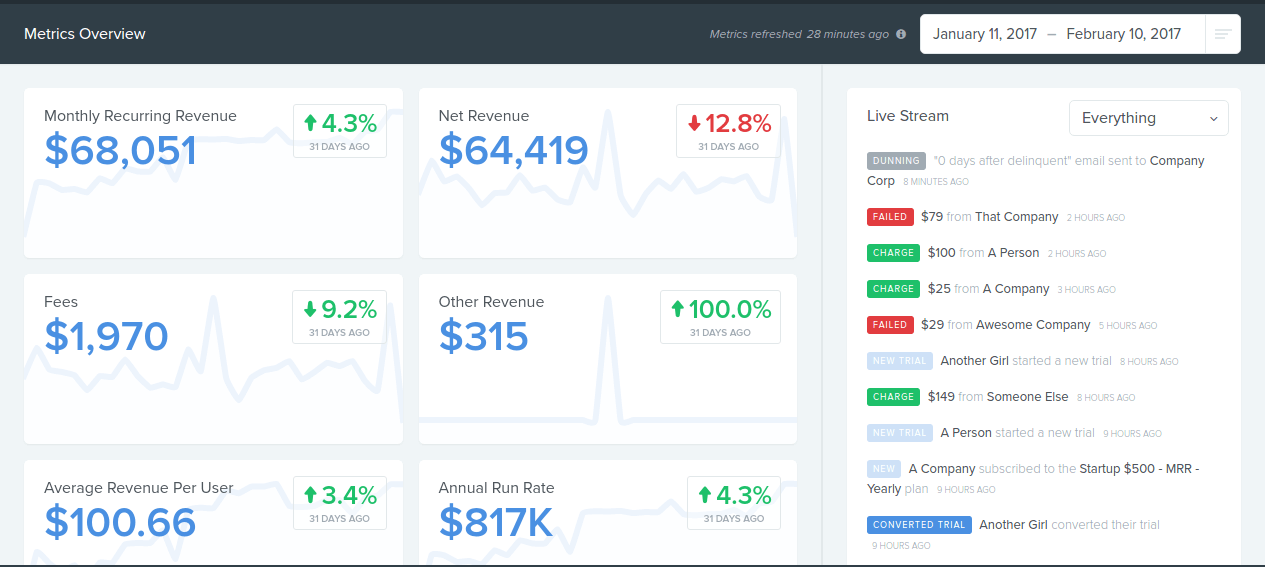
Subscription businesses being the target niche, Baremetrics reports includes a global dashboard providing all important subscriptions metrics. Monthly Recurring Revenue, Annual Run Rate, Refunds…. a total of 20 metrics in a single dashboard. Next to the dashboard is the live streaming of recent transactions- upgrades, failed transactions, churned customers, etc.
Along with the global dashboard, there are individual dashboards for each of the 20 metrics highlighting complete details. These dashboards boast of pretty graphs and all required information. No doubt, Baremetrics has done a good job here.
Forecasts
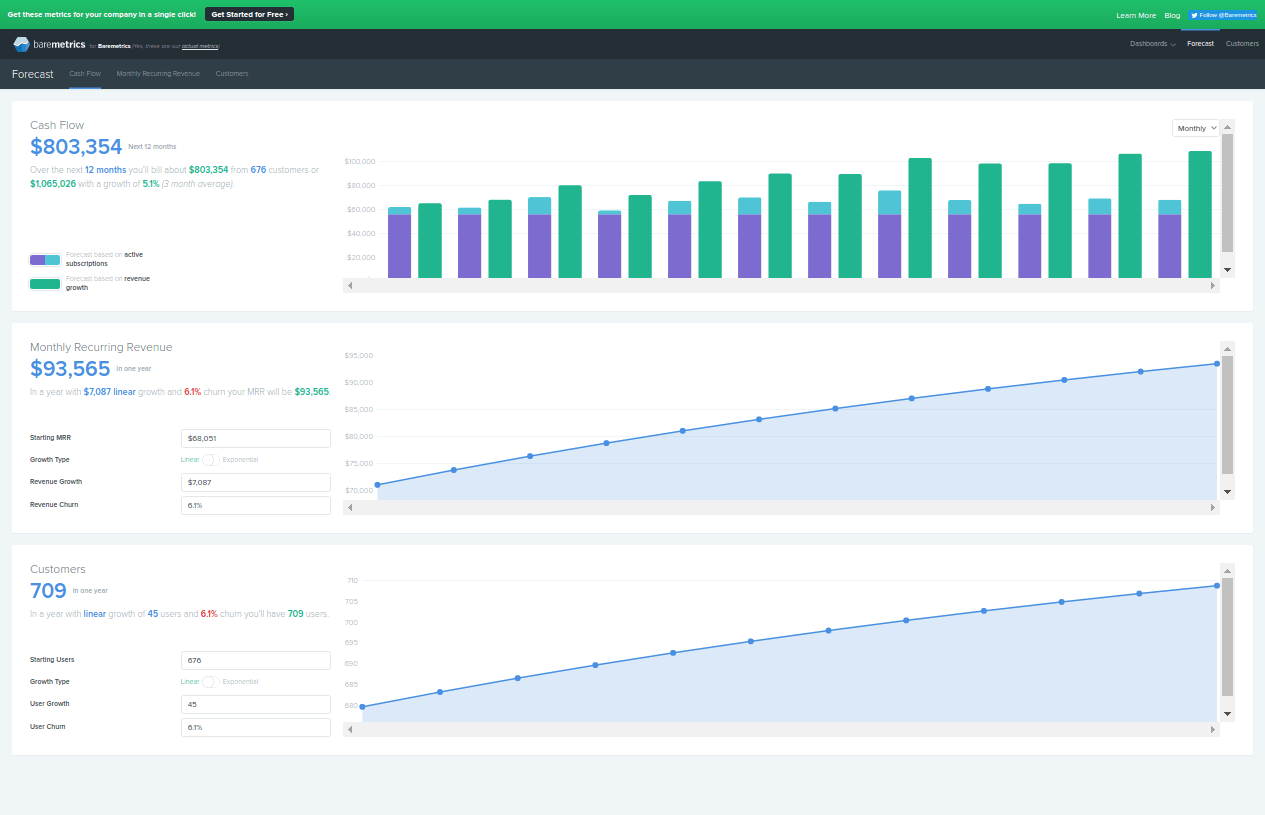
Baremetrics provides forecasts for three categories:
- Cash flow: The total value you will bill to a particular number of customers over the next 12 months
- Monthly Recurring Revenue: Your MRR in one year considering churn rate
- Customers: Number of customers you will acquire
These three forecasts are presented in a graphical form along with some other metrics. Again, pretty simple to understand.
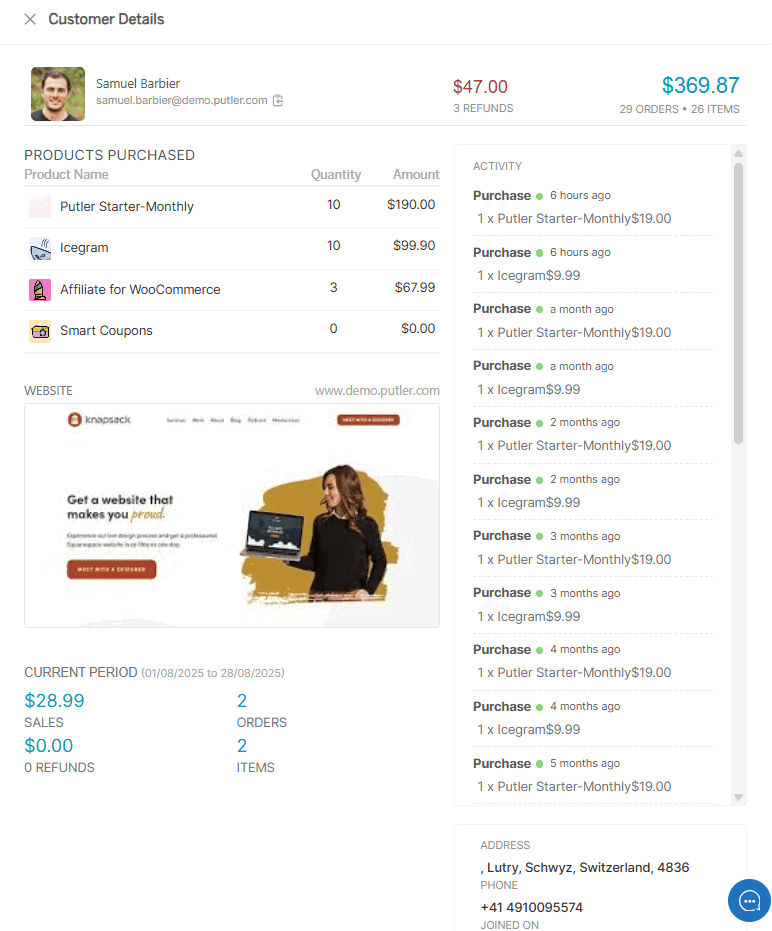
Customer Profiles
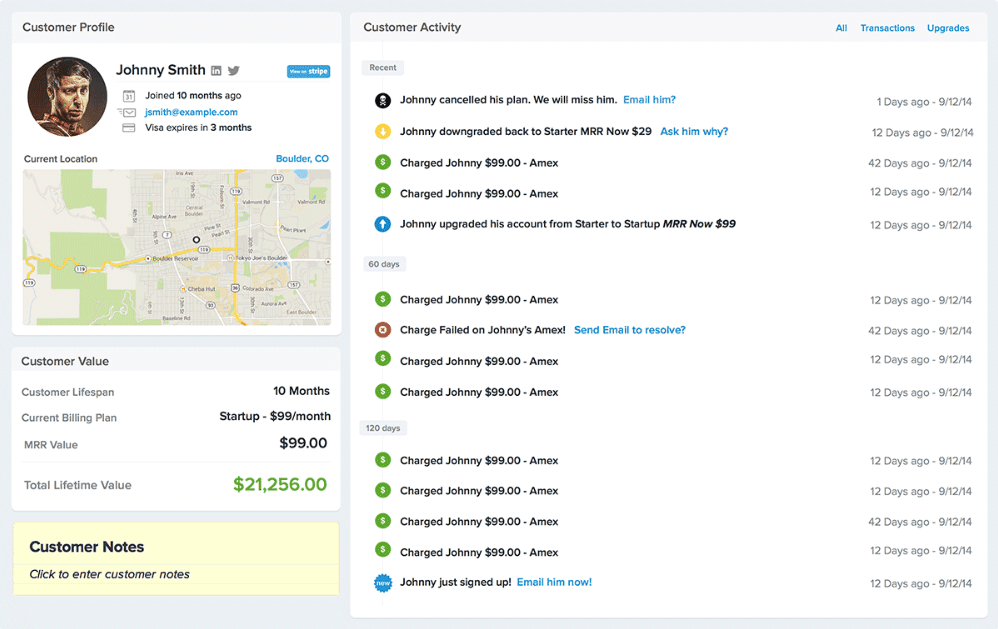
Customer profile means you get all the relevant and complete details of all your customers.
These details include: customer name and address, social media profile links, his credit card expiry date, lifetime value, entire transaction history- upgrades, downgrades, etc.
Email Reports & Notifications
Baremetrics can send daily, weekly & monthly email reports and notifications to you and your team so that you are being updated about your business activities. These reports include data like customer transaction status – whether he downgraded or cancelled his subscription. Or possibly there was a failed payment.
Credit Card Dunning
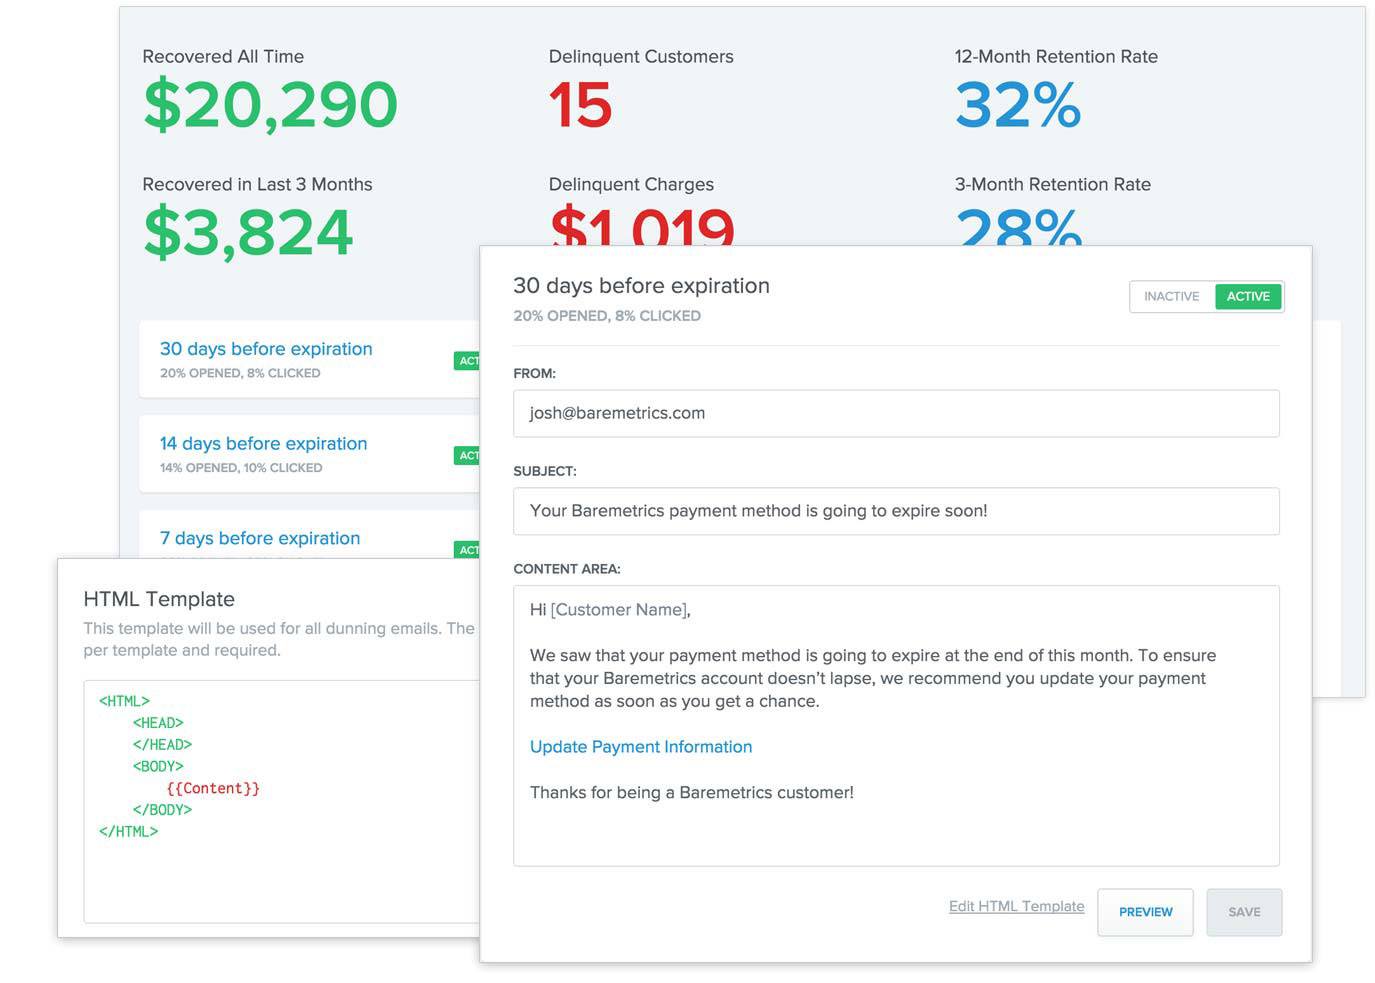
Handling recurring billing and payments is a challenge for SaaS companies due to multiple credit card issues such as failed payments, expired credit cards, blocked cards or limit issues.
However, before such a problem arises, an email is sent to the customer updating them about their card status so that there is not any transaction failure during upgrades or switch over to plans.
Insights
Baremetrics says: one-click, zero-setup subscription analytics & insights. But these insights are not separate. They are actually the metrics only that are covered in the their dashboards and reporting section.
Putler Reporting & Analytics
Dashboards & Metrics
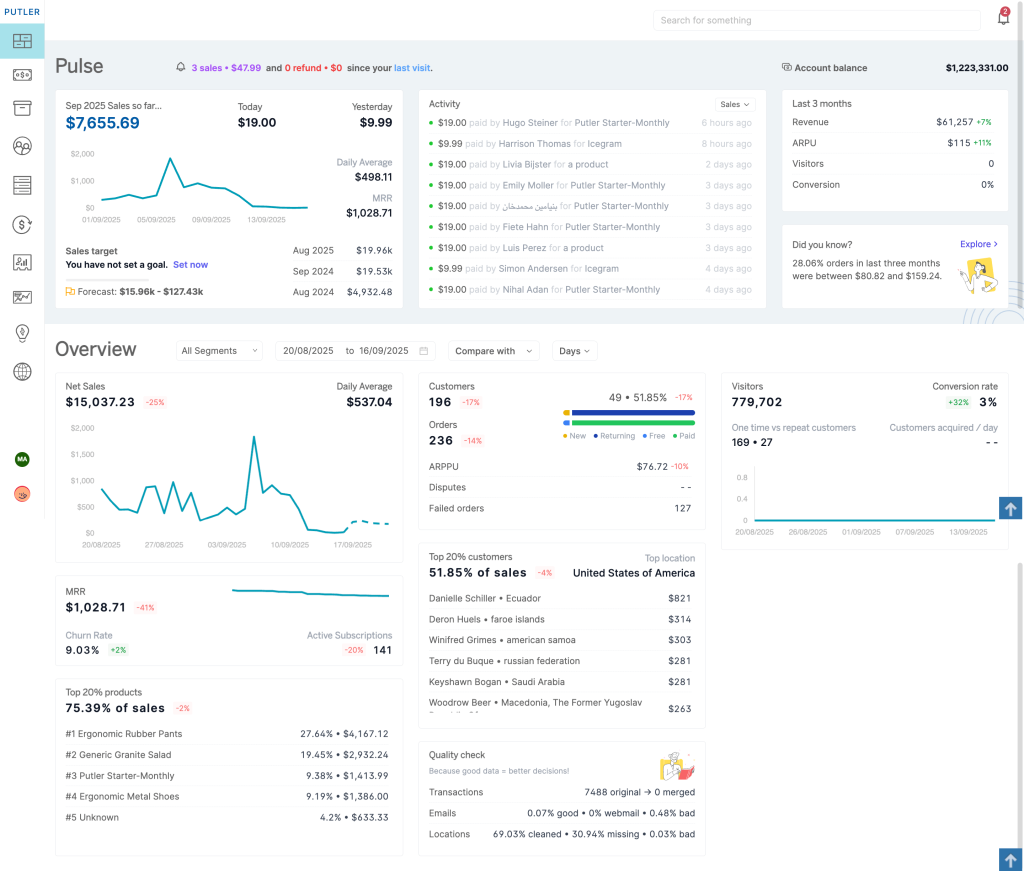
Using Putler, you get an overall business picture as well as individual dashboards that have business analytics as well as website analytics at a single place.
Along with the overall business view, Putler provides 6 in-depth dashboards covering 153+ important metrics and KPI’s. These are:
- Sales dashboard: Time-wise sales, refunds, orders, monthly target, best time when maximum sales occurred, etc.
- Subscriptions dashboard: MRR, Churn, ARPU, LTV, etc.
- Transactions dashboard: Fees, taxes, type of payment, etc.
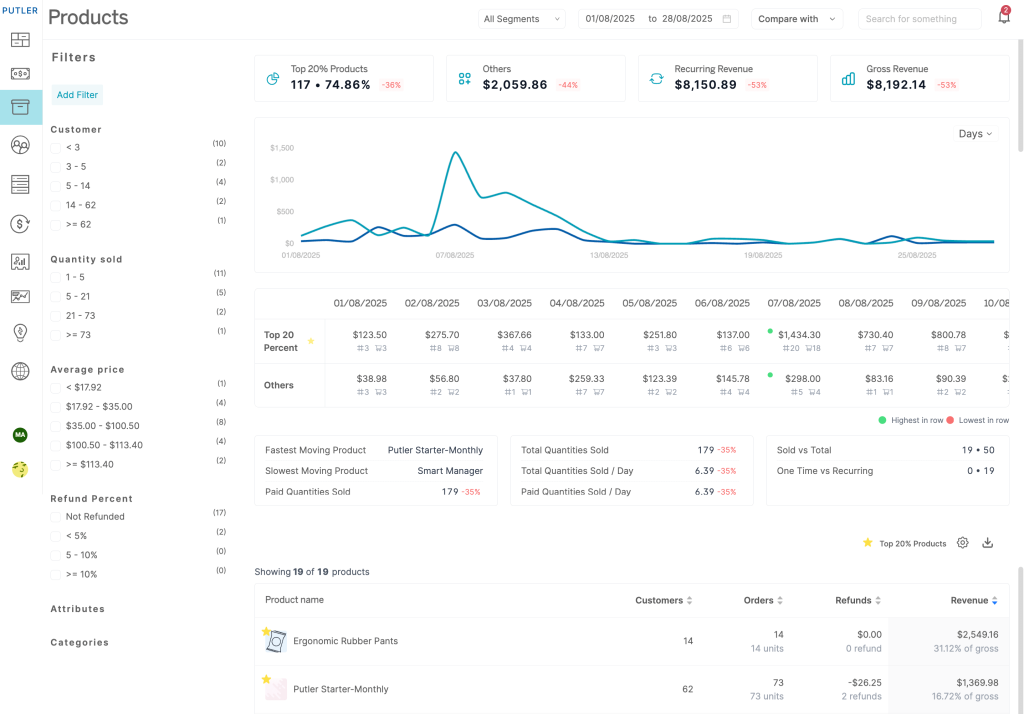
- Products dashboard: Product leaderboard, top 20% products, best and worst sellers, etc.
- Customer dashboard: Name, address, returning customers, etc.
- Visitors / Audience dashboard: Top pages, search terms linking to your website, bounce rate, revenue from different countries, etc.
- These dashboards give you all the much needed data you need for your business to grow.
- Select any dashboard, click on a particular element and you will get every bit of it.
Learn more about Putler’s metrics & dashboards.
Google Analytics Integration
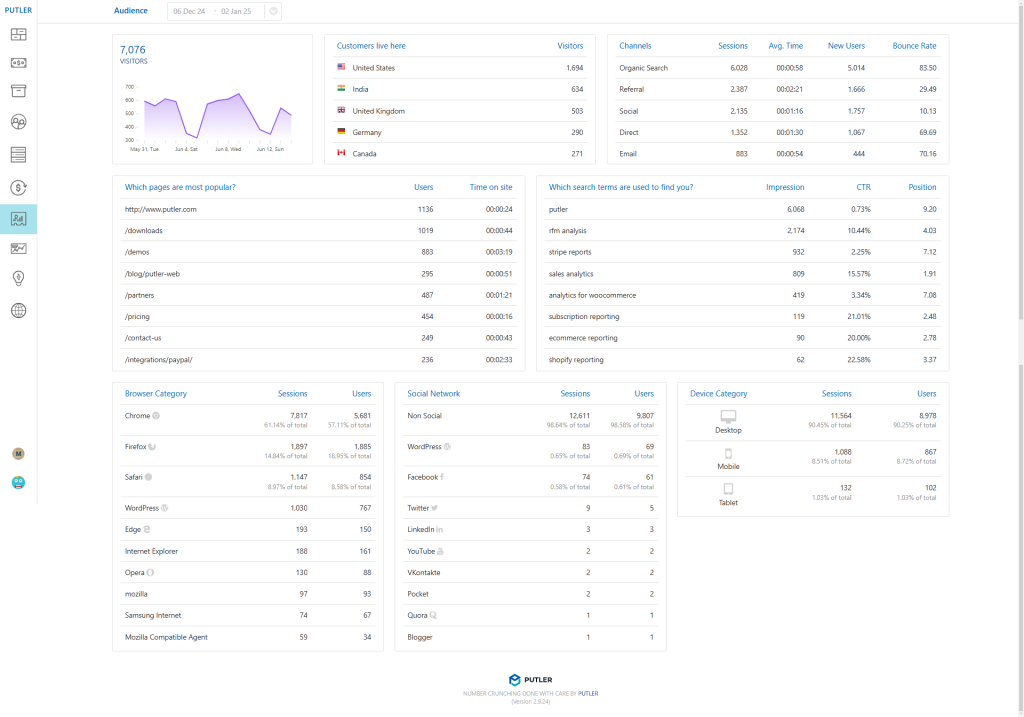
As Putler also has a direct Google Analytics integration in addition to payment gateways and shopping carts, you get a combined reports of eCommerce analytics and website analytics data at one place. Metrics like:
- Top landing pages
- Bounce Rate
- Search terms
- Number of visitors from different countries
and many more..
Just Google Analytics data is too complex to understand and non-tracking of refunds gives you false sales figures. But with Putler, you don’t need to worry of your sales figures or other data. They are always accurate.
Intuitive Search
Looking up for a transaction? In less than 5 seconds, you get the desired search results. Putler’s search works at a blazing speed.
Managing subscriptions & refunds
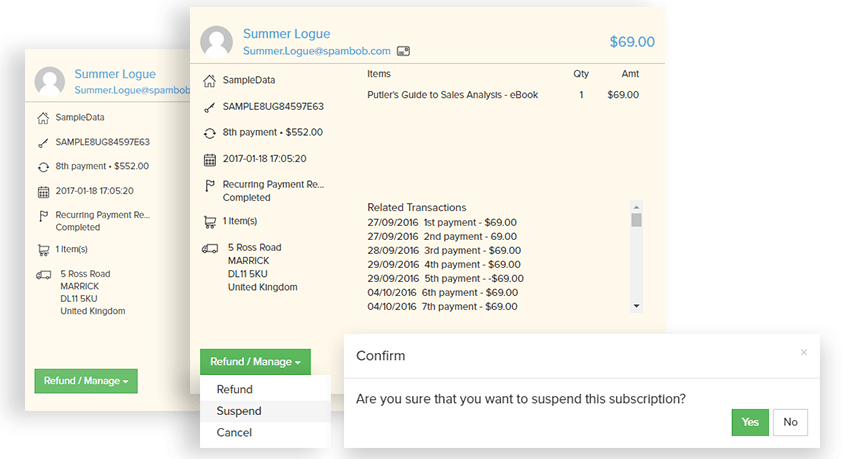
If you are stuck with the lengthy process of managing subscriptions of payment gateways, bid farewell to it. Using Putler, you can easily manage the subscription process without any hassle. Suspend, cancel, reactivate and refund recurring payment subscriptions all done easily.
Also with Putler, you can issue refunds directly to customers. Just two clicks and the process is done. You can even select what products to refund, or what % to refund.
RFM (Recency Frequency Monetary) Analysis
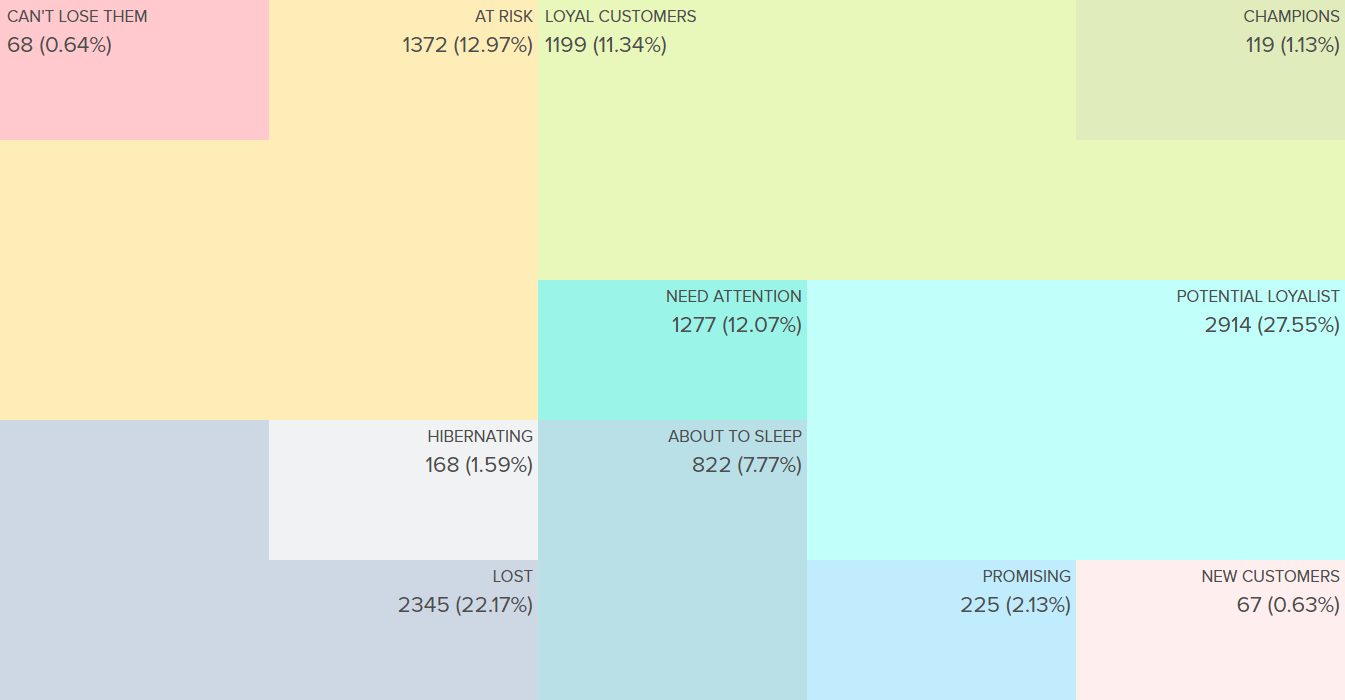
Customers are the lifeline of business and which customers turn out to be the most profitable ones needs special attention. These customers can be found out by a unique technique called RFM. It’s the best way to understand your different customer segments.
After complete analysis, 11 different customer segments are created- the best customers, loyal customers, customers on the verge of churn, lost customers, etc.
Easily understand your potential customers and send relevant marketing emails to retain them.
For example- The Champions Segment has 119 customers. These sets of customers are your best and most profitable ones. They make purchases frequently, spend very good amount and they recently made a purchase.
Customer Profiles
Putler Insights: Going Beyond Number
Putler gives not only the metrics covered in the dashboards. But also actionable insights / growth tips that are completely unique and developed by deeply analyzing your business. Here’s an example below:
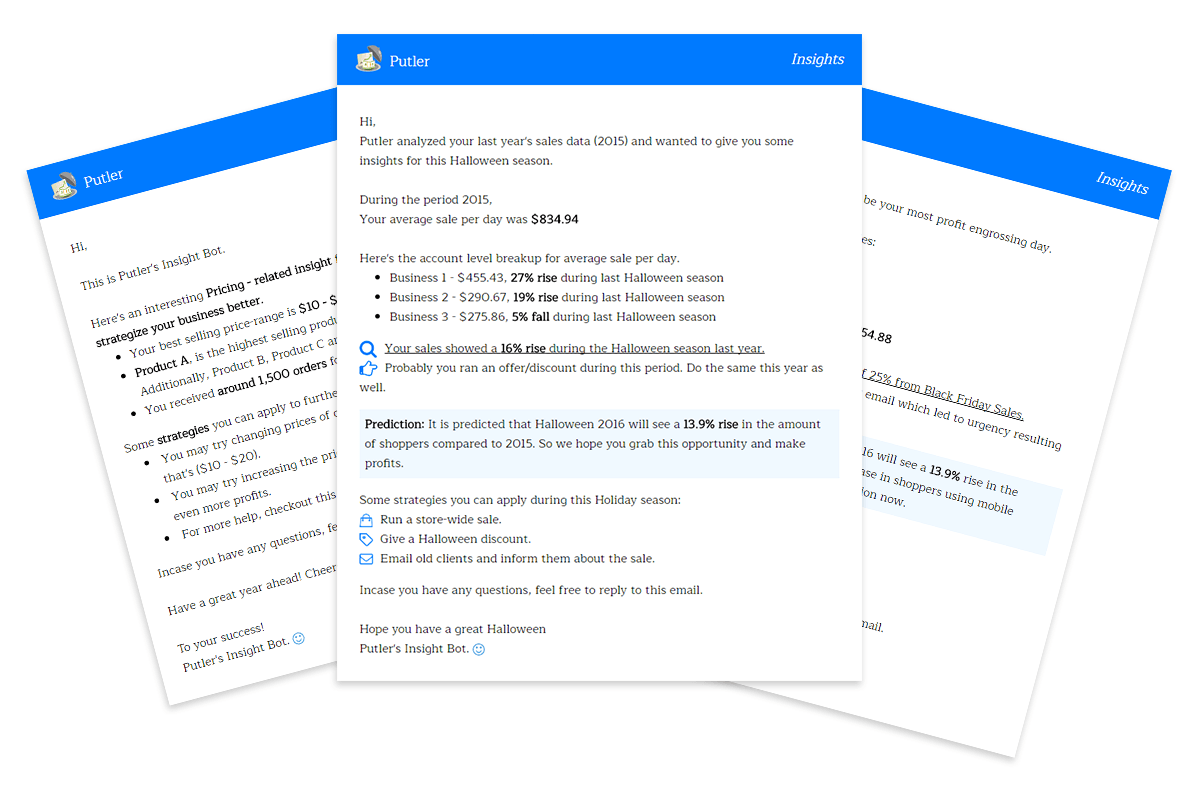
Instead of limiting itself to dashboards, Putler also provides actionable growth insights and tips. These are generated by deeply analyzing your business data, spotting trends, and highlighting opportunities. In addition, you’ll find expert advice and practical suggestions inspired by real-world business strategies – so you get not just numbers, but context you can act on.
Baremetrics Pricing
Baremetrics has moved away from MRR-based tiers and now prices its tools as separate modules. This means you only pay for the features you need, but costs can add up quickly if you want the complete suite.
Here’s the current breakdown:
- Metrics: $208/month – Core dashboards and subscription metrics.
- Recover: $158/month – Failed payment recovery (dunning).
- Cancellation Insights: $108/month – Understand and reduce churn.
- Forecast+: Included with Metrics – Financial and growth forecasts.
In total, businesses looking for the full Baremetrics experience (Metrics + Recover + Cancellation Insights) will pay $474/month.
Baremetrics also offers a free trial, so you can test out the platform before making a decision.
Overall, this modular pricing gives flexibility, but it can get expensive compared to all-in-one alternatives, especially for growing SaaS and subscription businesses.
Putler Pricing
Putler follows a metered pricing model — the fee adjusts automatically based on your monthly revenue. This ensures smaller businesses start at a low cost, while larger businesses scale fairly with their growth.
- Plans start at just $20/month for businesses making under $10K in revenue.
- Pricing gradually increases with higher revenue brackets
- Custom plans are available for Enterprises.
NOTE: The pricing automatically adjusts itself in case of rise/fall in revenue.
Putler also offers a 14-day free trial with all features unlocked, so you can try it risk-free before committing.
In short, Putler’s pricing is far more flexible and affordable than Baremetrics’ static tiers, making it a better fit for businesses at every stage.
Baremetrics vs Putler: Side-by-Side Comparison
Both Baremetrics and Putler are powerful analytics tools, but they serve slightly different audiences. To make things clearer, here’s a feature-by-feature comparison:
| Features | Baremetrics | Putler |
|---|---|---|
| Business Niche | Focused on Subscription businesses | Supports all online businesses, including eCommerce & subscriptions |
| Direct Integrations | Stripe, Braintree, Recurly, Chargify | PayPal, Stripe, Braintree, WooCommerce, Shopify, , Etsy, Google Analytics, and more |
| Other Integrations | Via Baremetrics API | Via Putler API |
| Multiple Currency Support | Contact Baremetrics team | Direct |
| Consolidation | Yes. But can’t see individual stats | Yes. Can see individual stats as well as combined |
| Dashboards & Metrics | One main dashboard consisting of 20 metrics + 20 dashboards for each of the above metric + live transactions dashboard | One main dashboard- ecommerce & visitors combined. 6 additional dashboards consisting of 153+ metrics |
| Intuitive Search | No | Yes |
| Credit Card Dunning | Yes | No |
| Subscription Management & Refunds | No | Yes |
| Send Money | No | Yes |
| RFM (Customer Segmentation) | No | Yes |
| Email Reports & Notifications | Yes | Yes |
| Customer Profiles | Yes | Yes |
| Forecasts | Yes | Yes |
| Cohorts | Yes | Yes |
| Insights | Metrics only | Metrics + actionable growth tips + expert advices |
| Pricing | $208 | $20 |
Conclusion – Which Tool Should You Choose?
Both Baremetrics and Putler are powerful analytics tools, but they serve different business needs. Baremetrics is designed mainly for SaaS and subscription-first companies, offering deep subscription metrics, forecasts, and dunning features. If your focus is purely on managing recurring revenue and customer churn, it’s a solid choice.
Putler, however, goes much further. It supports all types of online businesses – eCommerce, SaaS, and multi-channel sellers – with advanced features like 153+ metrics, multi-currency dashboards, RFM segmentation, refunds, subscription management, and even actionable growth insights. On top of that, its flexible pricing makes it far more affordable and scalable as your business grows.
How Does Putler Compare With Other Analytical Tools?
| Features | Putler | ChartMogul | Baremetrics | Metorik |
|---|---|---|---|---|
| SaaS Metrics | ✅ | ✅ | ✅ | ✅ |
| Non SaaS Metrics | ✅ | ✅ | ❌ | ✅ |
| Website Analytics | ✅ | ✅ | ❌ | ✅ |
| Integrations | 17+ | 49 | 10 | 19 |
| Multi-currency Support | ✅ | ✅ | ✅ | ✅ |
| Customer Segmentation (RFM) | ✅ | ✅ | ✅ | ✅ |
| Subscription Management & Refund | ✅ | ❌ | ⚠️ Limited (dunning only) | ⚠️ Cart automation |
| Insights & Actionable Tips | ✅ Expert-driven | 📊 Data-only | 📊 Metrics + dashboards | 📊 Reports only |
| Best For | 🌍 Multi-channel businesses | 💻 SaaS tracking | 🔄 Billing health focus | 🛒 eCommerce stores |
| Pricing | $20 | $199 | $208 | $25 |
FAQs
Q1: Is there a more affordable alternative to Baremetrics?
Yes. While Baremetrics can get expensive as your revenue grows, alternatives like Putler offer more features at a fraction of the cost – starting at just $20/month with no MRR-based pricing.
Q2: Which tool integrates with PayPal, WooCommerce, and other platforms Baremetrics doesn’t support?
Baremetrics is limited mainly to Stripe and a few SaaS platforms. Putler, on the other hand, integrates with PayPal, Stripe, WooCommerce, Shopify, Etsy, Google Analytics, and 15+ other platforms, making it ideal for businesses beyond SaaS.
Q3: Can I track both subscription metrics and eCommerce sales in one place?
Baremetrics is subscription-only. If you also run an eCommerce store or sell across channels, you’ll need a broader tool. Putler combines subscription analytics, eCommerce reporting, and website insights into one dashboard.
Q4: Does Putler offer customer segmentation and actionable growth insights?
Absolutely. Baremetrics focuses on dashboards, while Putler goes further with RFM segmentation, customer insights, and practical growth tips – so you don’t just see numbers, you know exactly what actions to take.
Q5: How hard is it to switch from Baremetrics to Putler?
Switching is seamless. Putler offers easy setup, API connections, and automatic data import so you don’t lose historical insights. Plus, you can try it free for 14 days before committing.