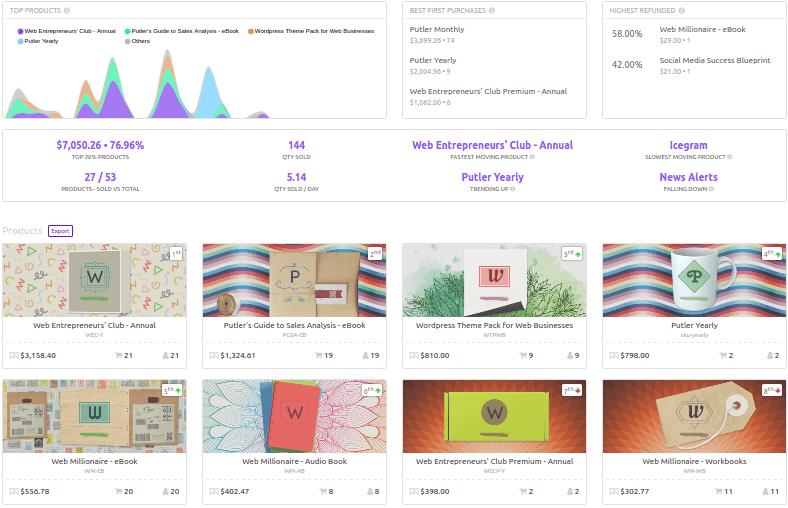
Top Products
The individual net sales performance of your top 4 products for the selected date range compared to the net sales of all your remaining products for the same date range.
Best First Purchases
This is the list of products that the customers buy the very first time they make a purchase on your store. After which they buy more products on your store.
This metric is based on the entire data.
Highest Refunded
List of products that have the highest % of refunds amongst all products for the selected date range.
Top 20% Products
The sum of net sales of your top 20% products for a selected date range.
How to find top 20% products and their sales –
Assume you have 100 unique products in your store, but only 50 products are sold. Then 20% of the products sold; 10 products whose contribution to the sales is maximum are arranged in the descending order. The sum of net sales of these 10 products and their % contribution to total sales is displayed.
Quantity Sold
The total number of product units sold for the selected date range.
Fastest Moving Product
The product with the most sale frequency irrespective of the total sale amount for the selected date range.
Example –
Product A – sold every hour, total sale amount – $2000, quantity sold – 52
Product B – sold every 4 hours, total sale amount – $1500, quantity sold – 13
Product C – sold every 2 hours, total sale amount – $5000, quantity sold – 26
In this case, the fastest moving product is A because its sale frequency is fastest (every hour) compared to B & C.
Slowest Moving Product
The product with the least sale frequency irrespective of the total sale amount for the selected date range.
Considering the same example above, the slowest moving product is B. This is because product B has the least sale frequency (every 4 hours) compared to A and C.
Products – Sold vs Total
The total number of individual product sold (not quantity) vs total individual products present in your store.
Example – If you have 50 unique products in your portfolio (irrespective of the quantity of each unique product) and only 20 unique products are sold, it will be shown 20 / 50.
Quantity Sold Per Day
The total quantity of product units sold for the selected date range divided by the number of days in the same date range.
Trending Up
The product which has jumped up tremendously in terms of sales on the product leaderboard in the currently selected date range compared to previous period.
Falling Down
The product which has fallen down tremendously in terms of sales on the product leaderboard in the currently selected date range compared to previous period.
Position – 1st, 2nd, 3rd …
The product contributing to maximum sales will be at position 1 followed by others in descending order of their contribution to sales.
Individual Product Card
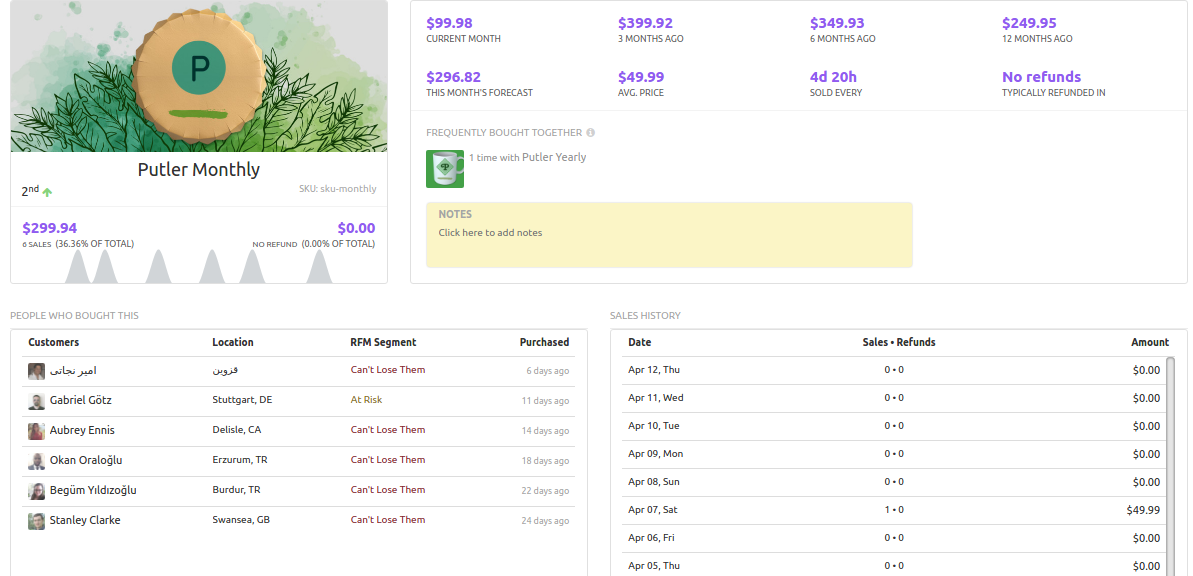
Net Sales this Month, 3 Months Ago, 6 Months Ago, 12 Months Ago
The net sales performance of a particular product as per various time periods.
This Month’s Forecast
The net predicted sales of a particular product for the entire current month.
Avg Price
The net sales of the product for the selected date range divided by quantity of that product sold for the same date range.
Sold Every
The average time required by a particular product to get sold. This metric is based on the entire data.
Example – If it shows 3d 11h, it means after every 3 days and 11 hours on an average, the product will be sold.
Typically Refunded In
The average time the product will take to get refunded. This metric is based on the entire data.
Example – If it shows 21d, it means after every 21 days on an average, this product will be refunded.
Frequently Bought Together
The products bought along with the product into consideration. This metric is based on the entire data.
Want to grow your business? Then don’t miss out on these product metrics!
Also check out: Sales Metrics, Transactions Metrics, Customer Metrics, Audience Metrics, Subscription Metrics, Time Machine Metrics, Insights, Home Metrics