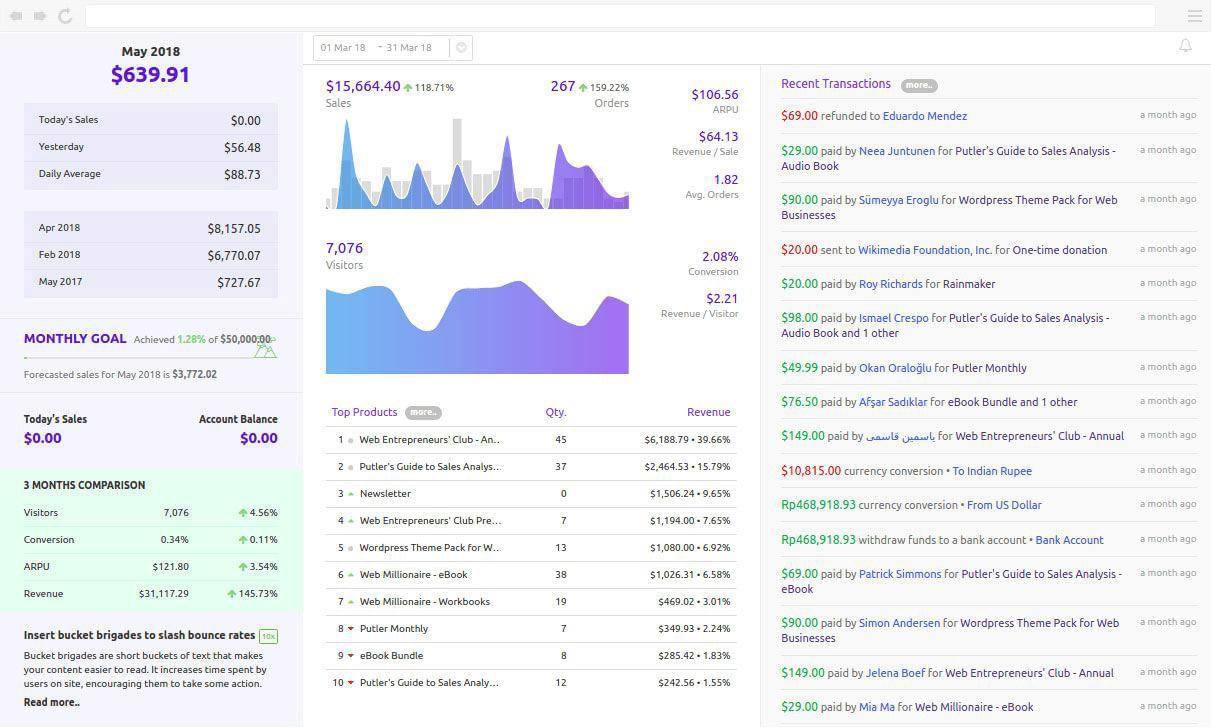
Daily Average
This is your average current month to date (and time) sales.
Daily average = (Month-to-date sales / Number of minutes till now from the start of the month) * 24 * 60
Example – If you are looking at Putler dashboard at 5 PM on June 20, 2018, the total minutes till now from the start of the month will be 28380 minutes. Assume the sales shown for the current month to date is $6870. So your daily average will be (6870/28380) * 24 * 60 = $349
ARPU
Average revenue per user (ARPU) is the net sales made during the selected date range divided by total number of customers (free + paid) for the same date range.
Average Revenue / Sale
The gross sales made during the selected date range divided by the sales quantity (total orders) received in the same date range.
Average Orders / Customer
The total number of orders received during the selected date range divided by the total number of customers in the same date range.
Monthly Goal
This is the sales target you wish to achieve for the entire current month.
Target Achieved
This is the actual sales you made for the particular month till date expressed as a percentage of the monthly goal you have set.
Forecasted sales for the current month
This is your sales prediction for your entire current month.
How this monthly forecasted is calculated:
Let’s say you want to calculate the forecast for June 2018:
- First, the average sales of previous three months (March 2018, April 2018 & May 2018) is calculated. – (A)
- Second, the average sales of the same three months but of the previous year (March 2017, April 2017 & May 2017) is calculated. – (B)
- Then, we calculate the trend by subtracting (B) from (A) and express it as a percentage. It may be positive or negative. – (C)
- Now, the month for which the forecast we need to find, (June 2018), we multiply this trend value (C) to the sales value of the same month but of the previous year (June 2017). – (D)
- The value (D) is the forecasted value.
- Note – If the previous year month’s values aren’t available, the average of previous three months of the current month, (A) will be the forecasted value.
Note – This forecast number is based on your historical data. It does not update as the month progresses. However, this is a more accurate way as it considers how you performed in the same month last year as well.
Account Balance
This is the sum of money in the payment gateways you have connected to Putler. This is not based on the selected date range.
Academy (Yellow color box)

A collection of useful resources and valuable content – tips to grow traffic, convert visitors, retain customers, grow sales, life quotes, business jokes, engaging videos and more.
3 Months Comparison (Green color box)
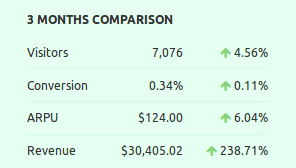
Three months comparison metric shows your visitors count, conversion rate, ARPU and revenue for the last 90 days / three months from today compared to its corresponding previous 90 days / three months. (% increase / % decrease).
Example – If you are viewing data on 1st May 2018, then this data will be of from 1st Feb 2018 – 1st May 2018 (90 days) compared to 3rd Nov 2017 – 31st Jan 2018 (90 days).
Want these metrics for your business?
Also check out: Sales Metrics, Transactions Metrics, Products Metrics, Customer Metrics, Audience Metrics, Subscription Metrics, Time Machine Metrics, Insights