
In the dynamic realm of online business, a seamless payment processing platform is your bedrock for growth, ensuring a smooth cash flow and unparalleled customer experiences. With the power of Stripe, conducting online transactions has never been easier.
However, when it comes to analyzing the data and gaining meaningful insights, things can get a bit tricky.
As a global business operating across multiple payment gateways and currencies, it becomes imperative to strengthen your analytics capabilities in order to supercharge your overall growth. That’s where finding the right Stripe reporting tool comes into play—an invaluable resource for harnessing the full potential of Stripe’s analytics.
In this guide, unlock your business’s true potential with Stripe reports and analytics and help you discover data-driven insights to fuel growth and gain a competitive edge.
Whether seasoned or starting out, gain the knowledge and strategies to drive your business confidently. Join us to uncover the secrets of maximizing your business potential with Stripe reporting.
But, let’s cover the basics first.
What is Stripe reporting?
Stripe reporting is the superpower that unveils the hidden treasures buried within your business transactions. When done right, Stripe reporting can offer valuable insights and metrics to fuel your growth. With these reports, you can effortlessly track and analyze key data points, such as revenue, customer behavior, and payment trends.
This treasure trove of information allows you to make data-driven decisions and optimize your business strategies. You can identify top-performing products, pinpoint areas for improvement, and understand your customers like never before.
Stripe reporting empowers you to generate detailed reports and visualize data with eye-catching charts and graphs. You can also customize your reports to focus on the metrics that matter most to your business. Whether you need a quick overview or an in-depth analysis, Stripe reporting has got your back.
In short, Stripe reporting is your trusty sidekick, illuminating the path to growth and success.
Types of analytic reports you get in Stripe
Similar to other payment gateways, Stripe also provides some in-house reports.
Here are all the reports that you can find within your Stripe dashboard.
Financial reports
Financial reports are a great way to keep a tab on the financial data of your Stripe account. This Stripe report helps track the flow of cash. The Financial Reports can be accessed through the dashboard using the Balance and the Payment Reconciliation tabs.
You can set the required date range and customize the time zone as per your local time to get the desired financial reports downloaded in CSV format.
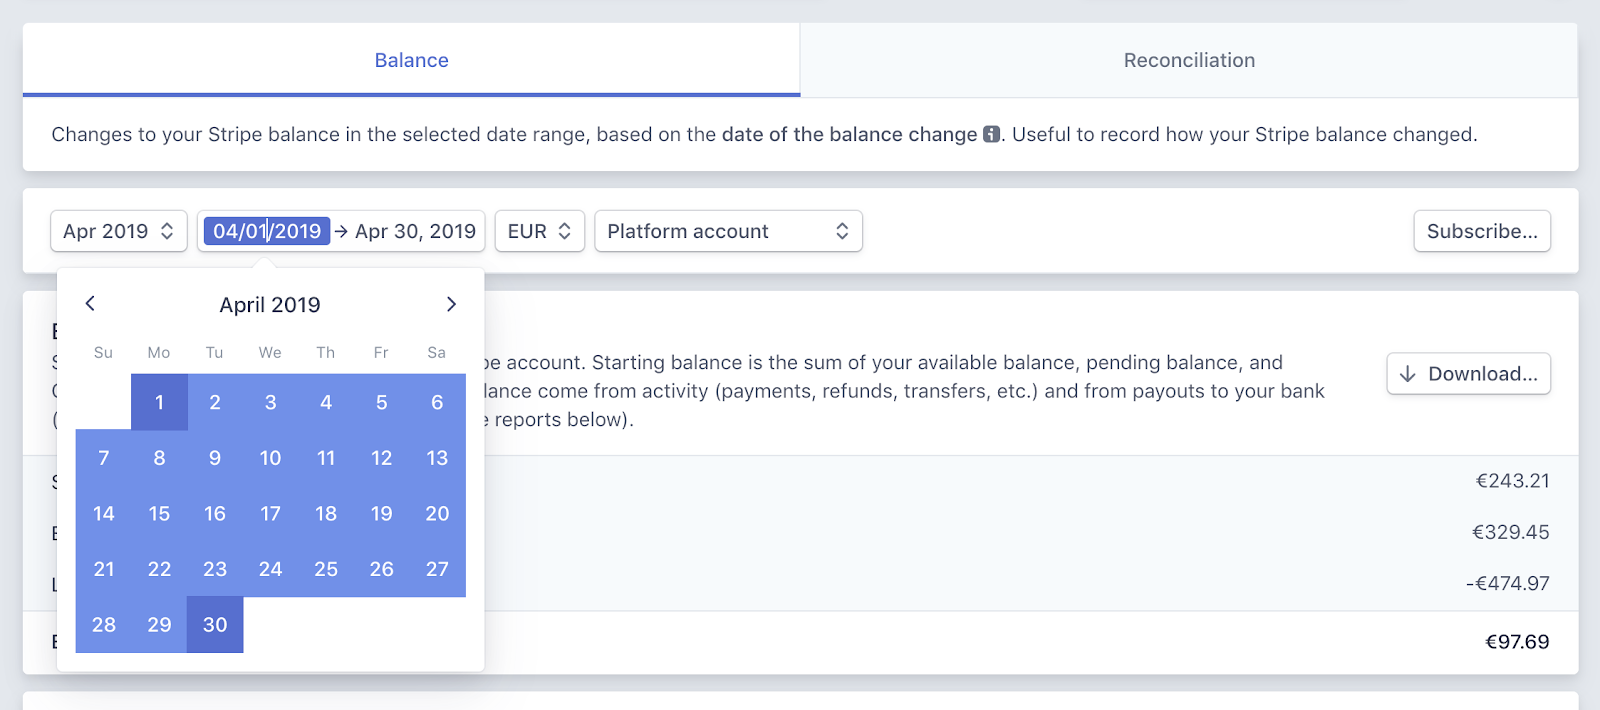
- Balance tab
- Payment reconciliation tab
Stripe lets you download and view the classified balance transaction data and its summary, which is essential for bookkeeping purposes. The data can be fetched on a daily, weekly, or monthly basis for tracking the insights.
The balance reports help you track how the balance of your Stripe account varies over a time period. This can give you a fair idea about the cash inflows and outflows against the timelines that can be used to develop business strategies.
This report looks similar to the Balance report but gives you insights into the automatic payouts that are reconciled to get an understanding of the transactions that have already been made and those that are yet to be made of the total scheduled payments. You receive this information in real-time which helps checking the status of pending payments at any given point in time.
Payment reconciliation involves comparing the internal payment data with external data, such as bank records, to ensure that the scheduled payments take place smoothly without errors.
Quickbook reports
While the dashboard reports tab lets you download the CSV files of the financial transactions, you can also export your Stripe account transaction reports to QuickBooks in the IIF file format. This file creates the following 9 accounts in Quickbooks which contain the Stripe data records:
Stripe account, Stripe checking account, Stripe payment processing fees, Stripe returns, Stripe sales, Stripe third-party account, stripe other fees, Stripe processing fees adj, and Stripe other income.
Custom reports
Apart from the financial reports and the Quickbook reports that you can download from the Stripe dashboard, you also have the option to opt for Stripe Sigma (an interactive SQL Environment, where data can be fetched via queries), or third-party integrations.
Limitations of Stripe reporting
- Multiple payment gateways: For businesses using multiple payment gateways, getting data records only from Stripe might not serve the purpose to its fullest. It is important to get consolidated financial analytics and insights for better business decisions.
- Multiple currencies: Businesses operating globally in different currencies face issues with Stripe and thus, the whole idea of reporting and analytics remains limited to cash flow reporting via Stripe.
- Products not defined in Stripe:Another problem involves around the products for which customers have made payment via a different gateway other than Stripe.
The three issues mentioned above could be hurdles on the path for growing your business. This is due to a lack of clear ideas about the financial insights that are essential for informed decision-making in your strategic planning process.
Suppose a businessman runs an online business: selling a wide range of products across different countries and accepting payment in their native currencies. He might not get the best analytics out of Stripe reporting.
This is because he would require metrics for all the products, including those products that have not been paid for via Stripe. He would also require consolidated data for his different payment gateways and multiple Stripe accounts to get the overall financial picture, for clearer insights.
If he only limits himself to Stripe reporting, he would miss out on some of the most important aspects.
So, what’s the solution? Or, should we say alternative?
Alternative Stripe reporting tools
Considering the limitations of Stripe reports, it makes sense to have an alternative Stripe reporting tool that provides you with different factors along with a broader perspective of the overall business finances.
Some of the best Stripe reporting tools available today are Putler, Baremetrics, ChartMogul, and MRR.io.
Let’s dig deeper into them.
Putler
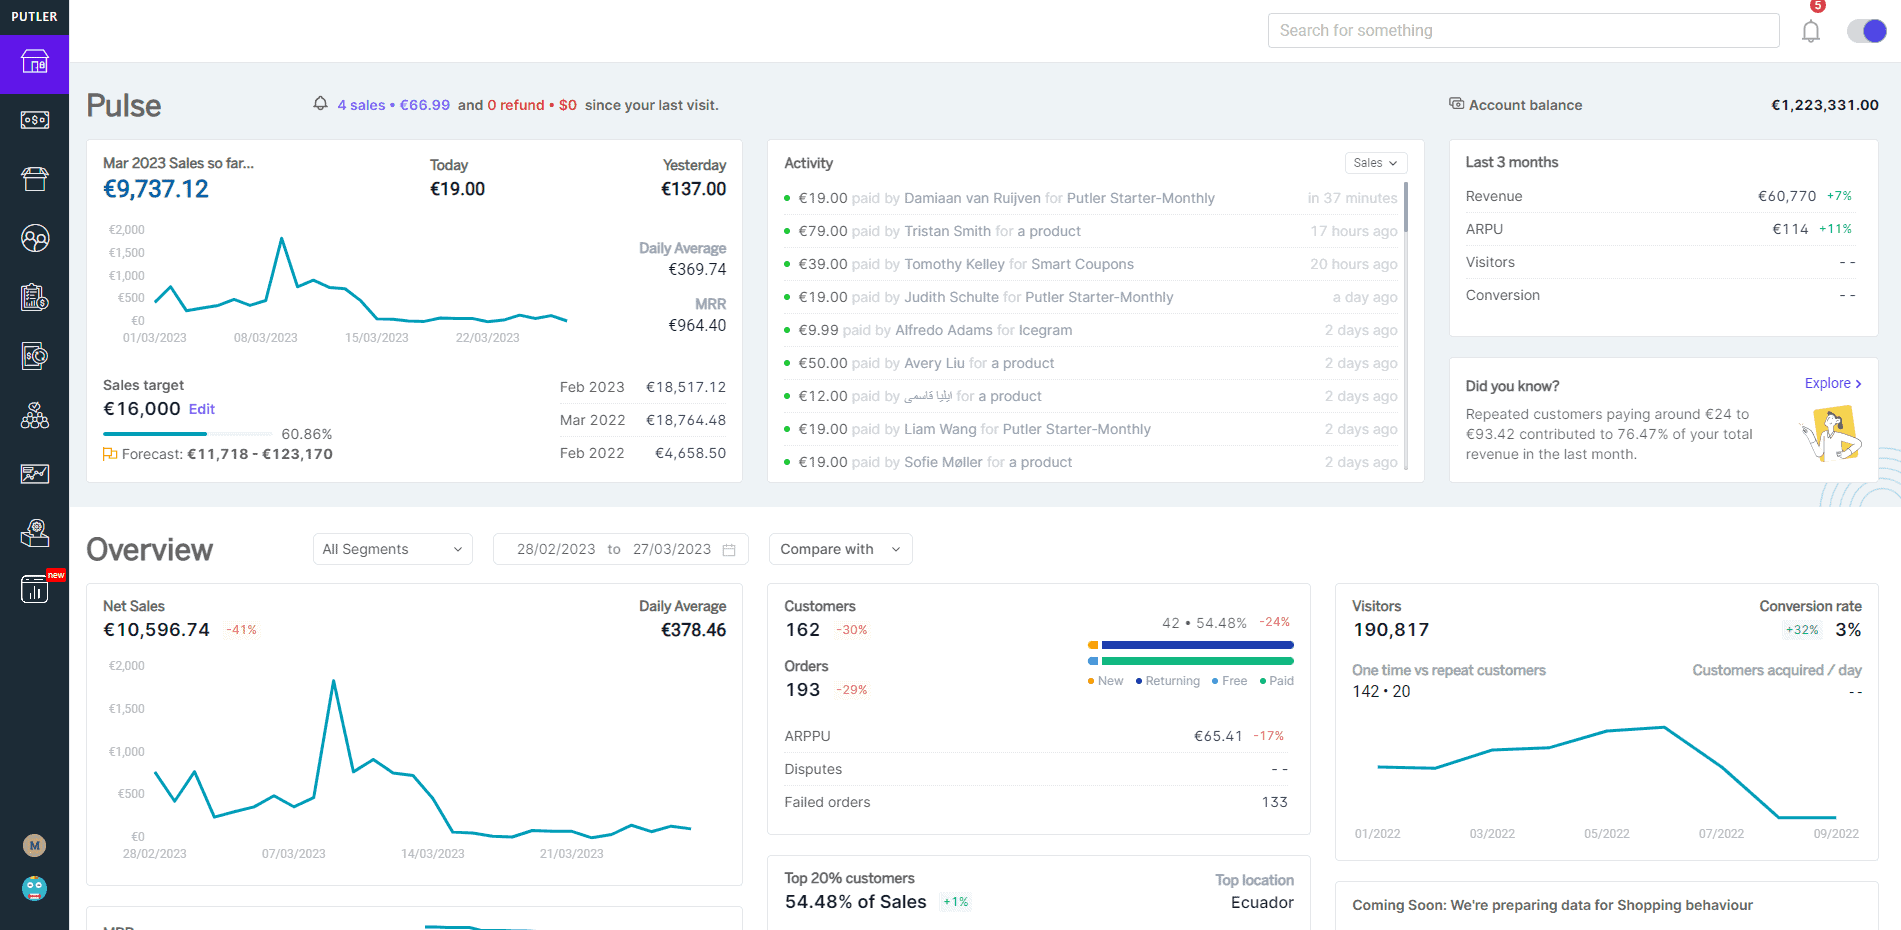
Putler offers a wide range of metrics and reports for your Stripe transactions. Known for its data-cleansing, accuracy, and robust Stripe management, Putler is one of the best alternative stripe reporting tools that provides you with every bit of information that you require to shoot up your business profits.
Baremetrics
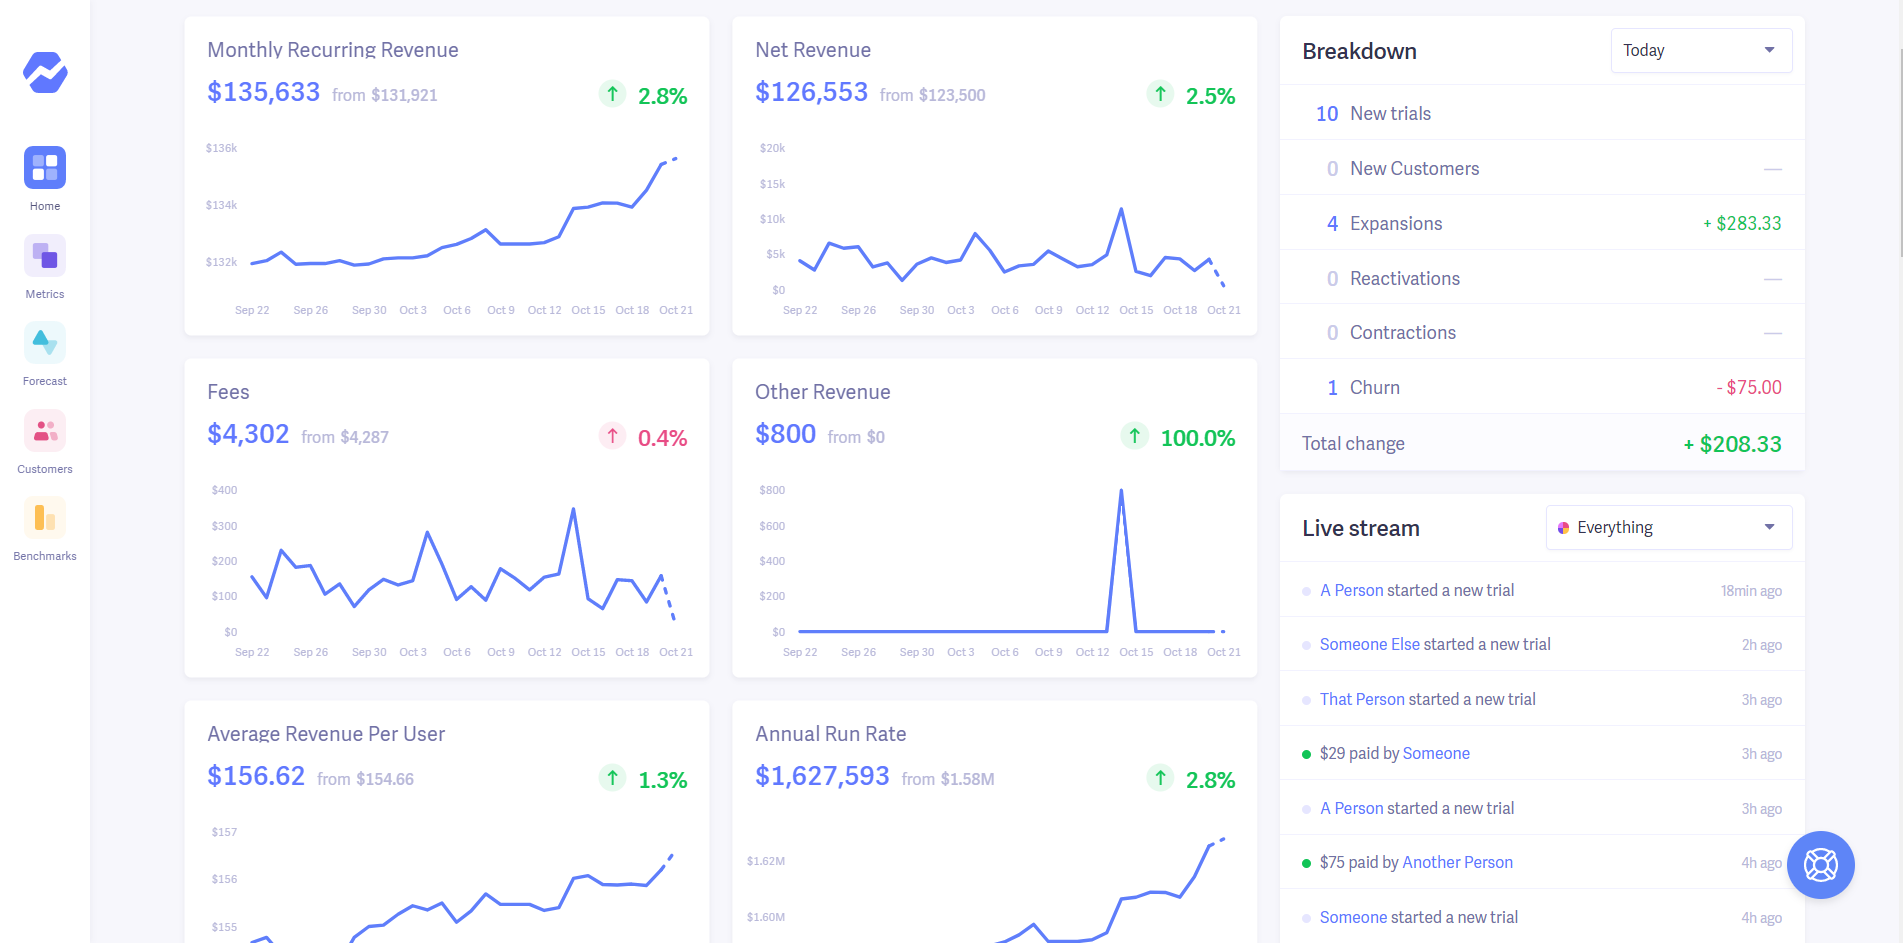
Baremetrics provides insights and analytics for businesses using payment platforms like Stripe, Recurly, etc. It offers simple integration that requires a little development work to get the desired financial analytics and reports.
ChartMogul
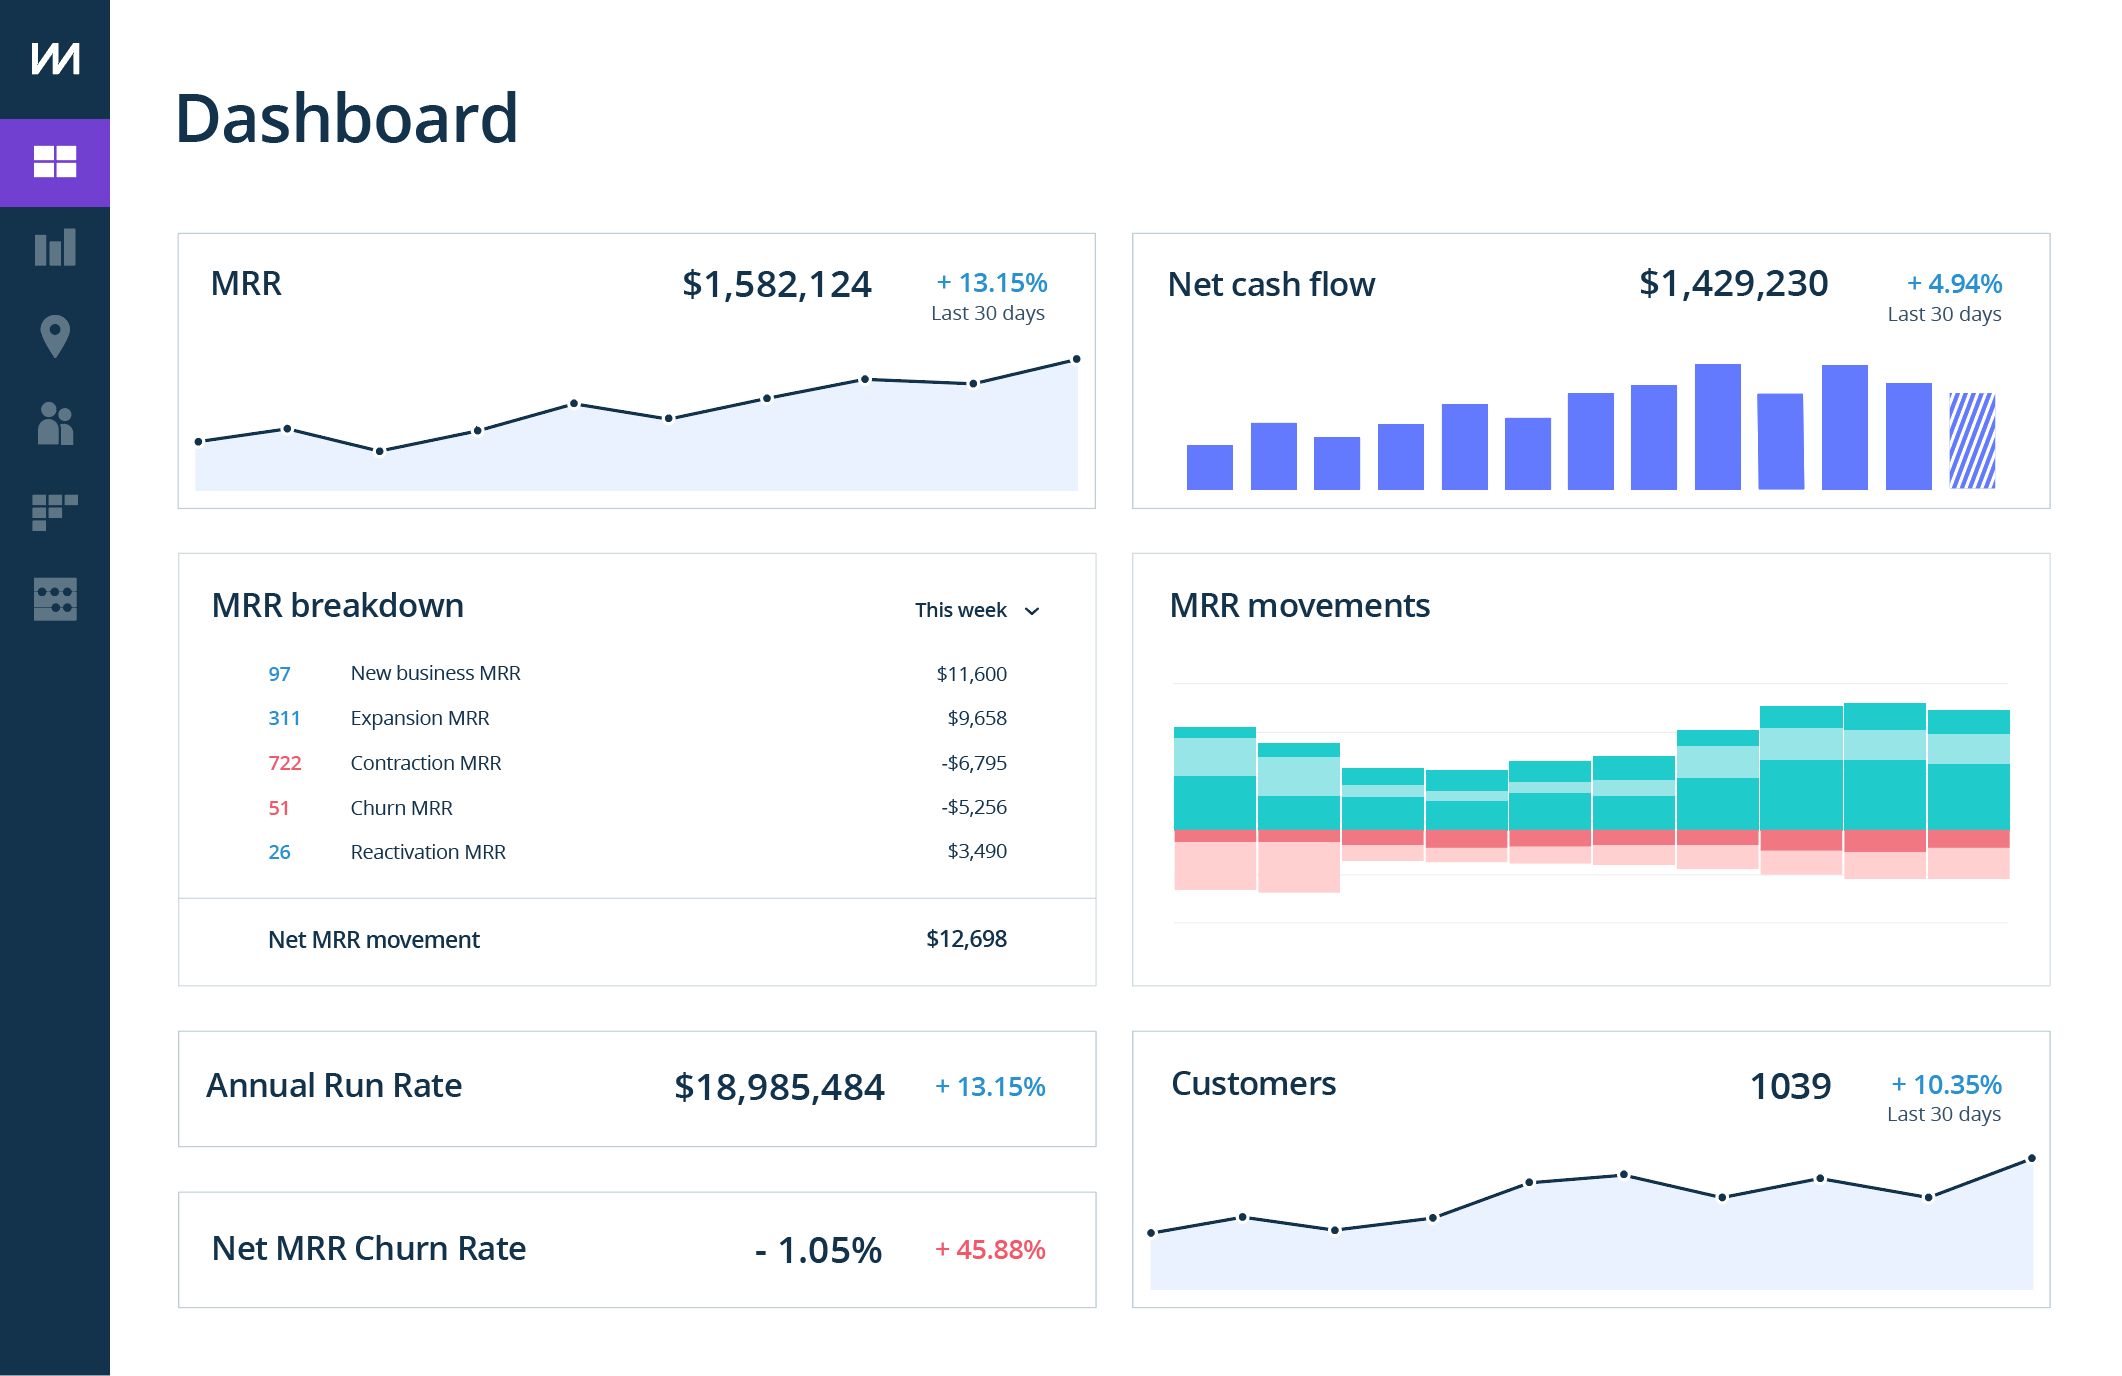
ChartMogul offers an in-depth MRR overview for your business analysts to enable diligent decision-making. With integrations to different payment gateways, ChartMogul offers detailed analytics solutions.
Best solution to tackle limitations of Stripe reporting
With the ease and flexibility that Stripe offers to online businesses, like making seamless transactions, there are a few limitations of Stripe reporting that inhibits the full-scale growth potential of your business.
Putler is a great choice for alternative Stripe reporting that lets you get detailed analytical reports and comprehensive insights to track your business performance closely. Given the accuracy and the wide range of metrics it offers, Putler is popularly recommended for growth-oriented business analytics and reporting.
Compared to ChartMogul and Baremetrics, it offers a larger number of direct integrations along with features like instant refunds, RFM analysis, customer analysis, subscription management, 200+ metrics, multiple currency support, inbound API, etc., making Putler a widely recommended Stripe reporting tool.
Diving deeper – Here are some key benefits that Putler offers, making it an ideal Stripe reporting tool for your growing business:
- Integration with Google Analytics
With Putler, you can not only keep an eye on the financial metrics but also get useful insights about the visitors via Google Analytics that are crucial for the growth and relevance of your business.
Putler not only integrates with Google analytics, but it also has its very own privacy-friendly web analytics solution that brings the most vital website analytics data on one page. Combining the Stripe metrics with Google Analytics & Putler Web Analytics you can churn out some breaking insights to crack the growth code!
- One-stop results
No need to switch between multiple accounts for tracking individual data and manually putting them together for total value as you do in Stripe.
Putler instead provides you with the entire data combined in one place for better analysis. Here’s how you can make the most out of Putler.
- Aggregation
It also fetches data from your multiple Stripe accounts, other payment gateways used by your business, different shopping carts, various currencies used in transactions, and your Google Analytics.
Putler takes this data a step forward by cleaning and enriching them to offer you deep business analytics, insights, and reports in a single user-friendly dashboard.
- Flexible
The best thing – Putler is flexible. You can choose to either see a consolidated view of all your data sources or view each of the reports individually.
This keeps all the analytics data in a single place, making it easy for you to compare and analyze the performance of your products/sales/orders/customers along with your overall business over any given time period, seamlessly.
- Multi-dimensional analysis
Putler offers in-depth analytics and reporting that can assist you in a multi-dimensional business analysis with over 200+ metrics, trends, and reports covering product, orders, customer, and sales analytics.
This helps the business in building integral strategies that are interdisciplinary and result in cumulative growth.
Practical use cases: everage Putler’s Stripe analytics to grow your business instantly
You can utilize Putler’s Stripe analytics to ensure the growth of your online business by using the following reports that would give you well-rounded insights.
Customer segmentation using RFM analysis
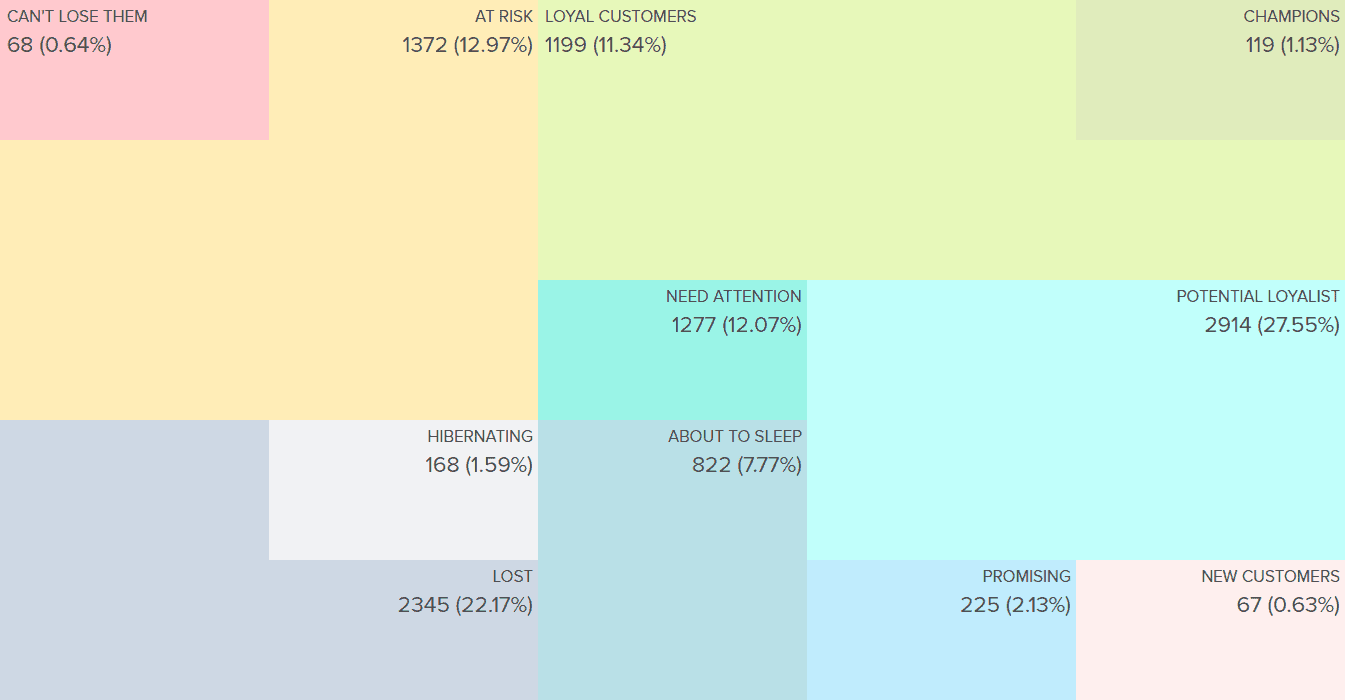
Putler segments your customers based on their buying behavior.
This powerful segmentation technique is called RFM [Recency-Frequency-Monetary] segmentation. With this, you will be able to define who are the buyers who have recently purchased your products, who purchase from you most frequently, and who have contributed the most to your business revenue.
This gives you a fair understanding of the popularity of your products among the target audience and the customer demographics. It can be helpful in cracking growth for your business via targeted marketing campaigns and product promotions.
Report forecasts using a time machine
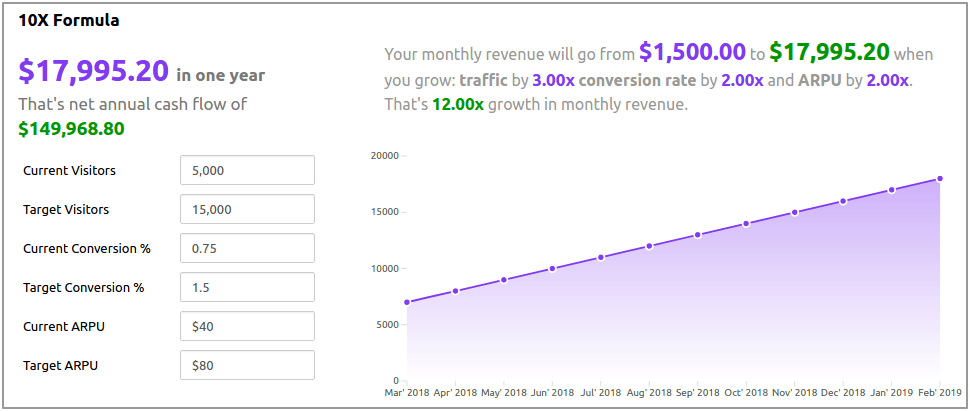
With Putler you can not only get detailed insights and metrics based on the data history, but at the same time, you also get future prediction reports and forecasts using the Time Machine feature. These projections on revenue and customers make planning future operations a lot easier, leading your way toward growth.
Having said that, you can leverage the power of analytics and multi-dimensional metrics with Putler to have comprehensive and detailed insights that could be useful in formulating strategies to decode growth at its best.
Conclusion
And there you have it, fearless entrepreneurs!
Congratulations on completing this thrilling expedition into the world of Stripe reporting and analytics! Together, we’ve uncovered the secrets to unlocking your business’s true potential.
With Putler by your side, dive into your data, seize golden opportunities, and watch your business soar to new heights. Embrace the power of Stripe reporting, wield data as your superpower, and let your dreams take flight on the wings of success!
Now, armed with knowledge and a powerful analytics tool, it’s time to chart your course to victory. Go forth with confidence and unleash the full potential of your business!
Onward to triumph!
FAQs
What metrics are calculated in Stripe?
Stripe calculates a range of essential metrics to help you understand and analyze your business’s performance. These metrics include revenue, transaction volume, average order value, customer acquisition cost, churn rate, and more. With Putler, a powerful analytics tool for Stripe, you can access these metrics and gain deeper insights into your business’s financial health and growth potential.
How do I get my reports from Stripe?
Getting your reports from Stripe is a breeze. Simply log in to your Stripe account and navigate to the reporting section. There, you’ll find a variety of pre-built reports and customization options to suit your needs. However, if you’re looking for a more comprehensive and user-friendly reporting experience, consider using Putler. Putler seamlessly integrates with Stripe, allowing you to access detailed reports, visually appealing charts, and advanced analytics features to optimize your business performance.
How do I get a Stripe balance report?
To get a Stripe balance report, select a date range using the controls at the top. The Balance summary section will show your starting and ending balances for that period. It also provides a summary of your activity.
Does Stripe automatically tax?
By default, Stripe does not calculate taxes. You need to configure your tax settings in the Stripe Dashboard. Once set up, Stripe Tax automatically calculates the correct tax rate based on your customer’s location. It supports various tax types for numerous products and services, ensuring compliance with current tax rules and rates.
Can I connect Stripe to Google Analytics?
Yes, you can connect Stripe to Google Analytics to gain a holistic view of your online business. By integrating these two powerful platforms, you can track and analyze your Stripe transactions alongside other website data in Google Analytics. This integration allows you to understand the full customer journey, from acquisition to conversion, and make data-driven decisions to drive growth. If you’re using Putler, it offers seamless integration with Google Analytics, enabling you to consolidate your Stripe data with other analytics insights for a comprehensive overview of your business performance.
Note: Putler offers enhanced reporting, analytics, and integration features for Stripe, complementing the capabilities of both Stripe and Google Analytics.
- Accurate analytics reports for Stripe
- Top analytics tools for Stripe