
Stripe is one of the most reliable payment processors out there. But here’s something most store owners discover only after they start growing. Stripe reporting has real gaps that can leave you flying blind on the metrics that matter most.
If you’re running a business across multiple payment gateways, selling in different currencies, or managing subscriptions alongside one-time purchases, the built-in Stripe dashboard only tells part of the story. That’s where understanding stripe reporting properly and knowing when to go beyond it — becomes a genuine competitive advantage.
In this guide, we’ll cover how Stripe reporting works, which stripe reports are available natively, where the gaps are, and which stripe reporting tool gives you the complete picture you actually need to grow.
What is Stripe reporting?
Stripe reporting is the process of collecting, organising, and analysing the financial and transactional data that flows through your Stripe account. When done right, Stripe reporting can offer valuable insights and metrics to fuel your growth.
With these reports, you can track and analyse key data points like revenue, customer behaviour, and payment trends. You can identify top-performing products, pinpoint areas for improvement, and understand your customers’ purchasing patterns over time.
Stripe reporting lets you generate detailed reports and visualise data through charts and graphs. You can also customise your reports to focus on the metrics that matter most to your business. Whether you need a quick overview or an in-depth analysis, Stripe reporting gives you the foundation to make data-driven decisions.
The challenge is knowing what Stripe covers well — and what it doesn’t.
Types of stripe reports in the Stripe dashboard
Like other payment gateways, Stripe provides a set of in-house reports directly accessible from the stripe dashboard. Here are all the reports you can find within your Stripe account.
Financial reports
Financial reports are a great way to keep track of your Stripe account’s financial data. This stripe report helps track the flow of cash. Financial reports are accessed through the dashboard using the Balance and Payment Reconciliation tabs.
You can set the required date range and customise the time zone to your local time to download the desired financial reports in CSV format.
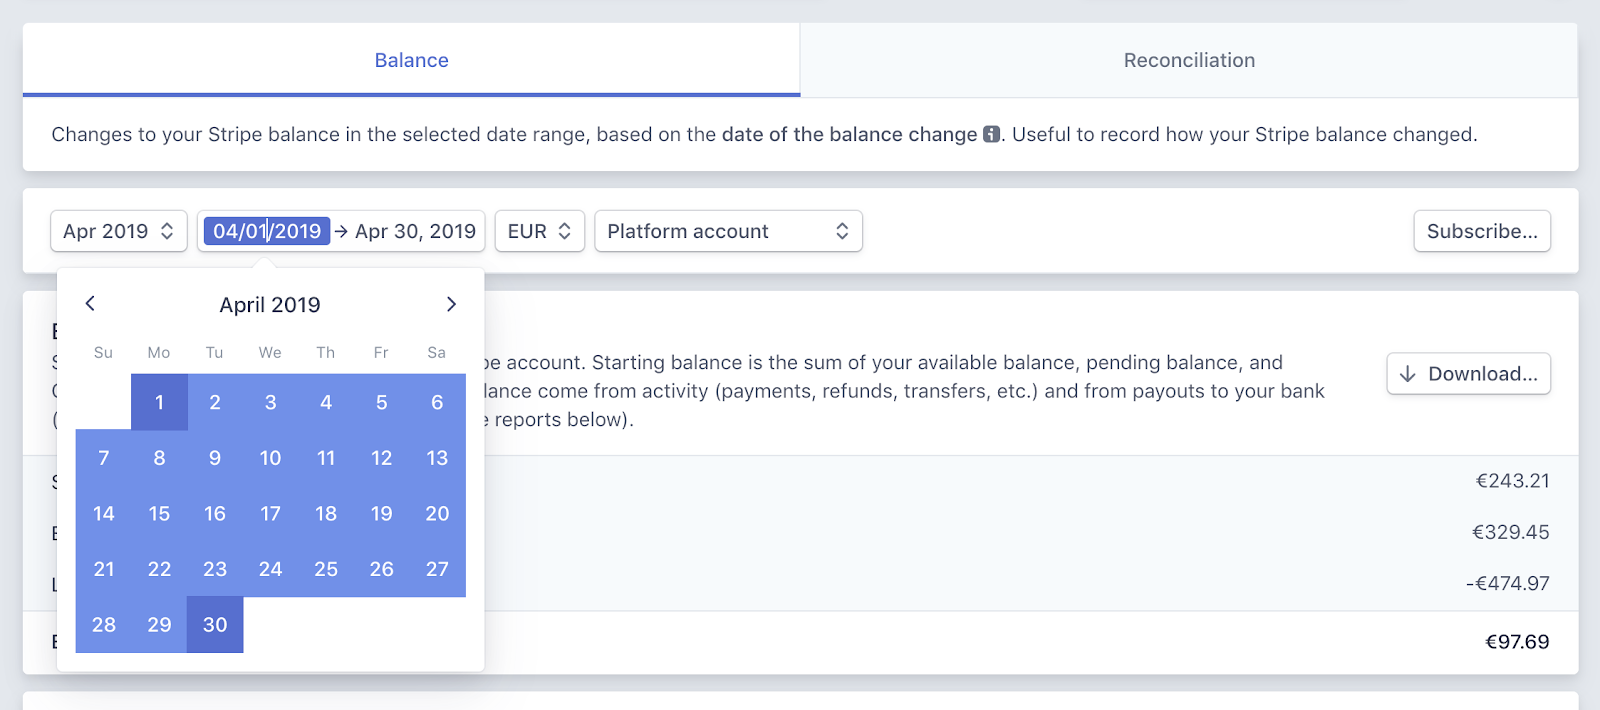
- Balance tab: Stripe lets you download and view classified balance transaction data and its summary, which is essential for bookkeeping purposes. The data can be fetched on a daily, weekly, or monthly basis. Balance reports help you track how your Stripe account balance varies over a time period, giving you a clear picture of cash inflows and outflows against specific timelines.
- Payment reconciliation tab: This report gives you insights into automatic payouts that are reconciled to show which transactions have already been made and which are still pending. You receive this information in real time, which helps you check the status of pending payments at any given point. Payment reconciliation involves comparing internal payment data with external records like bank statements to ensure scheduled payments go through without errors.
QuickBooks reports
While the dashboard reports tab lets you download CSV files of financial transactions, you can also export your Stripe account transaction reports to QuickBooks in IIF file format. This file creates nine accounts in QuickBooks containing your Stripe data records: Stripe account, Stripe checking account, Stripe payment processing fees, Stripe returns, Stripe sales, Stripe third-party account, Stripe other fees, Stripe processing fees adj, and Stripe other income.
Custom reports
Apart from the financial reports and the QuickBooks reports that you can download from the Stripe dashboard, you also have the option to use Stripe Sigma.
It is an interactive SQL environment where data can be fetched via queries or connect third-party integrations for more advanced reporting needs.
How to access stripe reports
Understanding what reports exist is one thing. Actually pulling them when you need them is where most people get stuck. Here is the straightforward path to accessing your stripe reports from the dashboard.
Step 1: Log in to your Stripe account and go to your Dashboard.
Step 2: In the left navigation menu, click on Reports.
Step 3: Select the report type you need. For financial data, choose between the Balance report and the Payout reconciliation report. For payment-specific insights, go to Payments analytics.
Step 4: Set your date range using the controls at the top of the report. Stripe computes data daily and reports are typically available by 12 pm the following day, so avoid pulling reports for periods that have not fully settled.
Step 5: Choose your timezone. Stripe defaults to UTC. If your accounting system uses local time, update this setting before downloading to avoid date mismatches.
Step 6: Click Download to export the report as a CSV file. For recurring needs, click Schedule to set up automatic daily, weekly, or monthly report delivery to your email.
Key stripe analytics metrics to track
Stripe’s dashboard surfaces basic transaction data, but subscription businesses need deeper metrics to understand true performance. Here are the numbers that actually matter when it comes to stripe analytics.
Revenue metrics:
- MRR (Monthly Recurring Revenue): The predictable revenue you earn each month from active subscriptions. Stripe calculates this, but may include trial users, which inflates your numbers.
- ARR (Annual Recurring Revenue): MRR multiplied by 12. Useful for long-term planning and investor reporting.
- Net New MRR: The sum of new MRR plus expansion MRR, minus churned and contraction MRR. This single number tells you whether you’re actually growing.
Customer metrics:
- Churn rate: The percentage of subscribers who cancel within a given period. Stripe shows revenue-based churn but doesn’t distinguish between voluntary cancellations and failed payments.
- LTV (Lifetime Value): The total revenue you expect from a customer before they churn. Calculated by dividing ARPU by your churn rate.
- ARPU (Average Revenue Per User): Your MRR divided by total active subscribers. Tracks whether you’re moving customers toward higher-value plans.
Operational metrics:
- Failed payment rate: The percentage of attempted charges that don’t go through. High rates signal issues with card expiration, insufficient funds, or fraud blocks.
- Trial conversion rate: How many free trial users convert to paid plans. Stripe tracks this, but only if you’ve correctly configured trial subscriptions.
The challenge is that Stripe surfaces these metrics across different dashboard sections. Drilling down into the why behind each number requires either SQL knowledge via Stripe Sigma or a dedicated third-party stripe analytics tool.
Stripe Sigma vs standard stripe reports
Stripe offers two tiers of reporting: the free dashboard reports and Stripe Sigma, their SQL-powered analytics tool. Understanding when each makes sense can save you both money and frustration.
Standard dashboard reports work well for:
- Basic balance and payout reconciliation
- Downloading transaction CSVs for your accountant
- Quick revenue snapshots and subscription counts
- Businesses processing under $100K annually
Stripe Sigma becomes necessary when:
- You need to segment MRR by product, plan, or customer cohort
- Custom queries like “churned customers by signup month” are required
- Your finance team wants to join Stripe data with other business metrics
- You’re building investor-ready reports with specific breakdowns
The cost consideration: Sigma starts at $10/month for the first 10 million events, then scales with usage. For early-stage startups, that’s reasonable. But here’s what most businesses discover: by the time you need Sigma’s capabilities, you usually also need data from sources Stripe can’t access — like your CRM, support tickets, or marketing spend.
Stripe also offers an AI-powered Sigma Assistant that lets you ask questions in plain English instead of writing SQL. You might type “Show monthly recurring revenue by product for the past 6 months” and it generates the query automatically. Useful, but still limited to Stripe-only data.
For businesses that have outgrown Sigma entirely, Stripe Data Pipeline takes things further by syncing your Stripe data directly to a data warehouse like Snowflake, Redshift, or BigQuery. This lets you join Stripe data with the rest of your business data for truly unified reporting. For most growing businesses though, a dedicated stripe reporting tool handles this more affordably and without the engineering overhead.
Limitations of Stripe reporting
- Multiple payment gateways: For businesses using multiple payment gateways, getting data records only from Stripe might not serve the purpose to its fullest. It is important to get consolidated financial analytics and insights for better business decisions. This same challenge applies to PayPal reporting and other gateway-specific dashboards.
- Multiple currencies: Businesses operating globally in different currencies face issues with Stripe, and thus, the whole idea of reporting and analytics remains limited to cash flow reporting via Stripe.
- Products not defined in Stripe: Another problem involves the products for which customers have made payment via a different gateway other than Stripe.
The three issues mentioned above could be hurdles on the path to growing your business. A lack of clear financial insights makes informed decision-making in your strategic planning process considerably harder.
Suppose a businessman runs an online business that sells a wide range of products across different countries and accepts payment in their native currencies. He might not get the best analytics out of Stripe reporting.
This is because he would require metrics for all the products, including those products that have not been paid for via Stripe. He would also require consolidated data across his different payment gateways and multiple Stripe accounts to get a clearer overall financial picture.
If he only limits himself to Stripe reporting, he would miss out on some of the most important aspects.
Common Stripe reporting mistakes
Even experienced finance teams make these errors when pulling Stripe reports. Avoid them to keep your numbers accurate.
Including trial users in MRR calculations: Stripe’s default MRR calculation may count active trials as paying subscribers. This inflates your recurring revenue and makes churn look worse when trials expire without converting. Always configure your billing settings to exclude trials, or verify your third-party tool handles this correctly.
Not distinguishing downgrades from cancellations: Stripe’s churn metrics show revenue lost, but don’t separate customers who downgraded to cheaper plans from those who cancelled entirely. A customer moving from $99/month to $29/month appears as $70 in churned revenue — the same as losing a $70 customer forever. These require very different retention strategies.
Ignoring failed payment data: Failed charges often get buried in Stripe’s reports. But involuntary churn from payment failures — expired cards, insufficient funds, bank declines — can represent 20 to 40% of total churn for subscription businesses. If you’re not tracking this separately, you’re missing a major recovery opportunity.
Timezone discrepancies: Stripe timestamps everything in UTC by default. If your accounting system, other payment gateways, or internal tools use local time, you’ll see transactions appearing on different days across systems. One sale on December 31st at 11 pm EST shows as January 1st in Stripe — a nightmare during month-end close.
Pulling reports before transactions settle: Invoice statuses change. A charge marked “pending” today might be “paid” or “failed” tomorrow. Downloading reports mid-cycle and treating them as final creates discrepancies that compound over time. Wait until all transactions in a period have settled before running reconciliation reports.
Alternative stripe reporting tools
Considering the limitations of Stripe reports, it makes sense to use a dedicated stripe reporting tool that gives you a broader perspective on your overall business finances — not just what flows through Stripe.
Some of the best Stripe reporting tools available today are Putler, Baremetrics, ChartMogul, and MRR.io.
Let’s dig deeper into them.
Putler
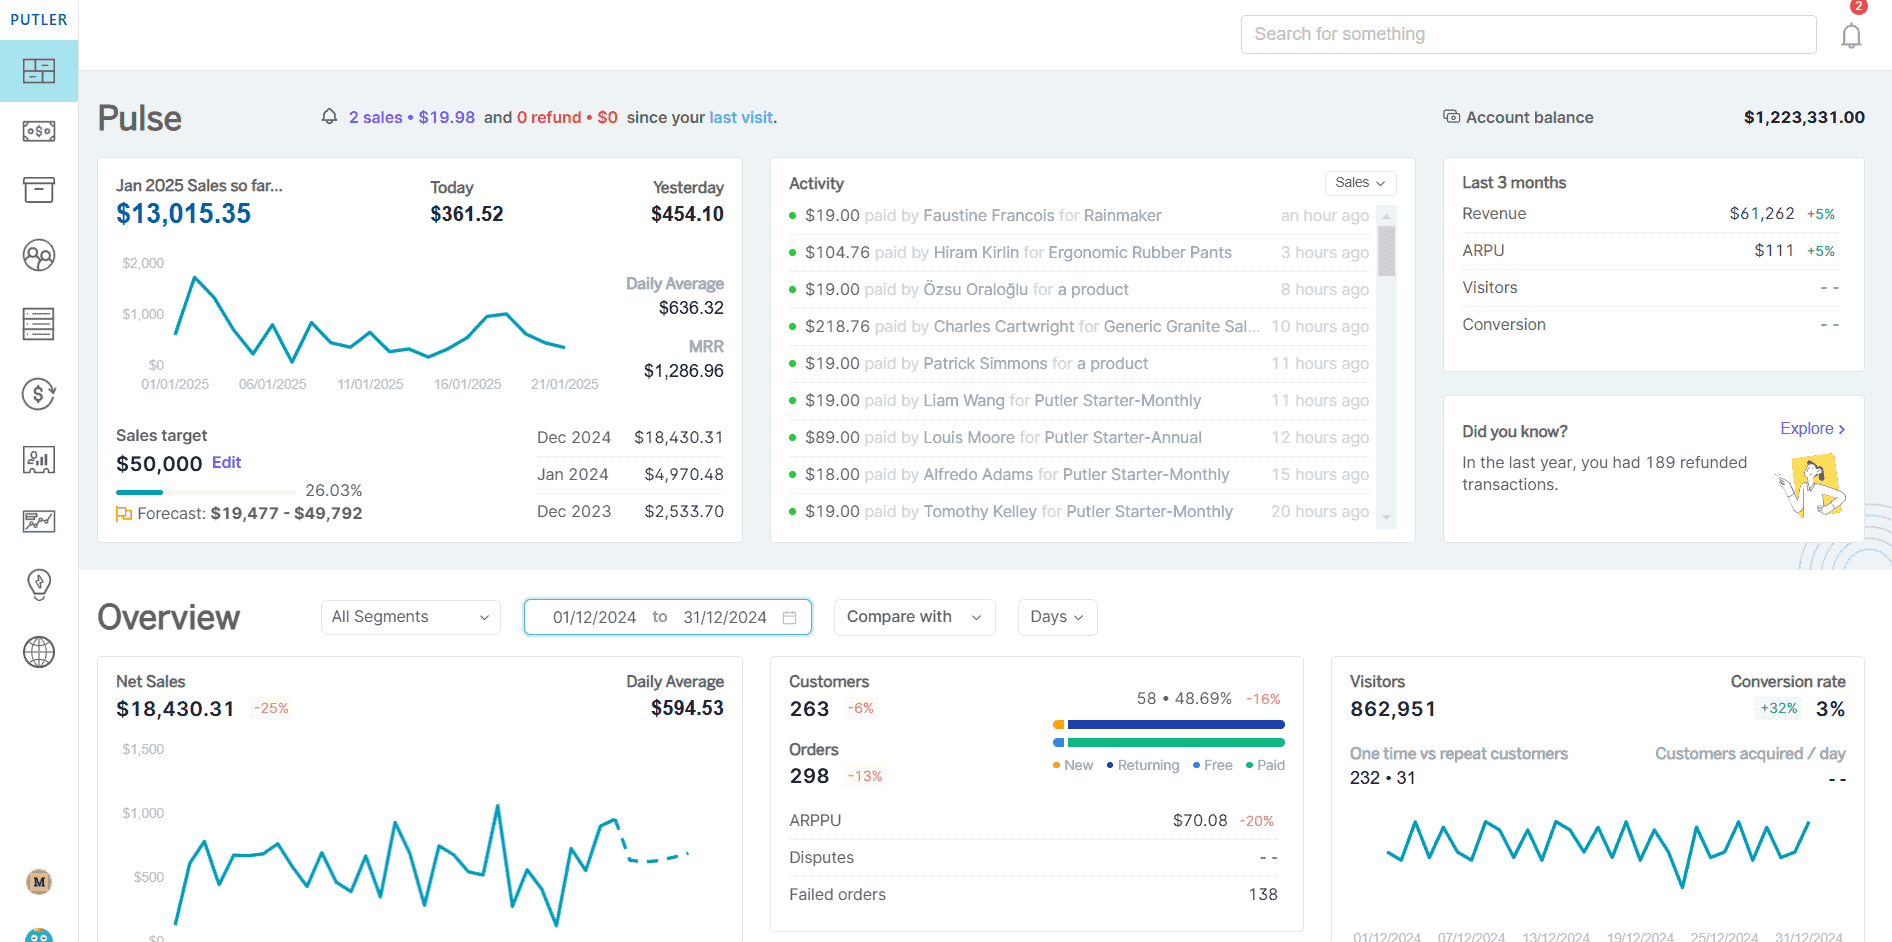
Putler offers a wide range of metrics and reports for your Stripe transactions. Known for its data-cleansing, accuracy, and robust Stripe management, Putler is one of the best alternative Stripe reporting tools that provides you with every bit of information that you require to boost your business profits.
Baremetrics
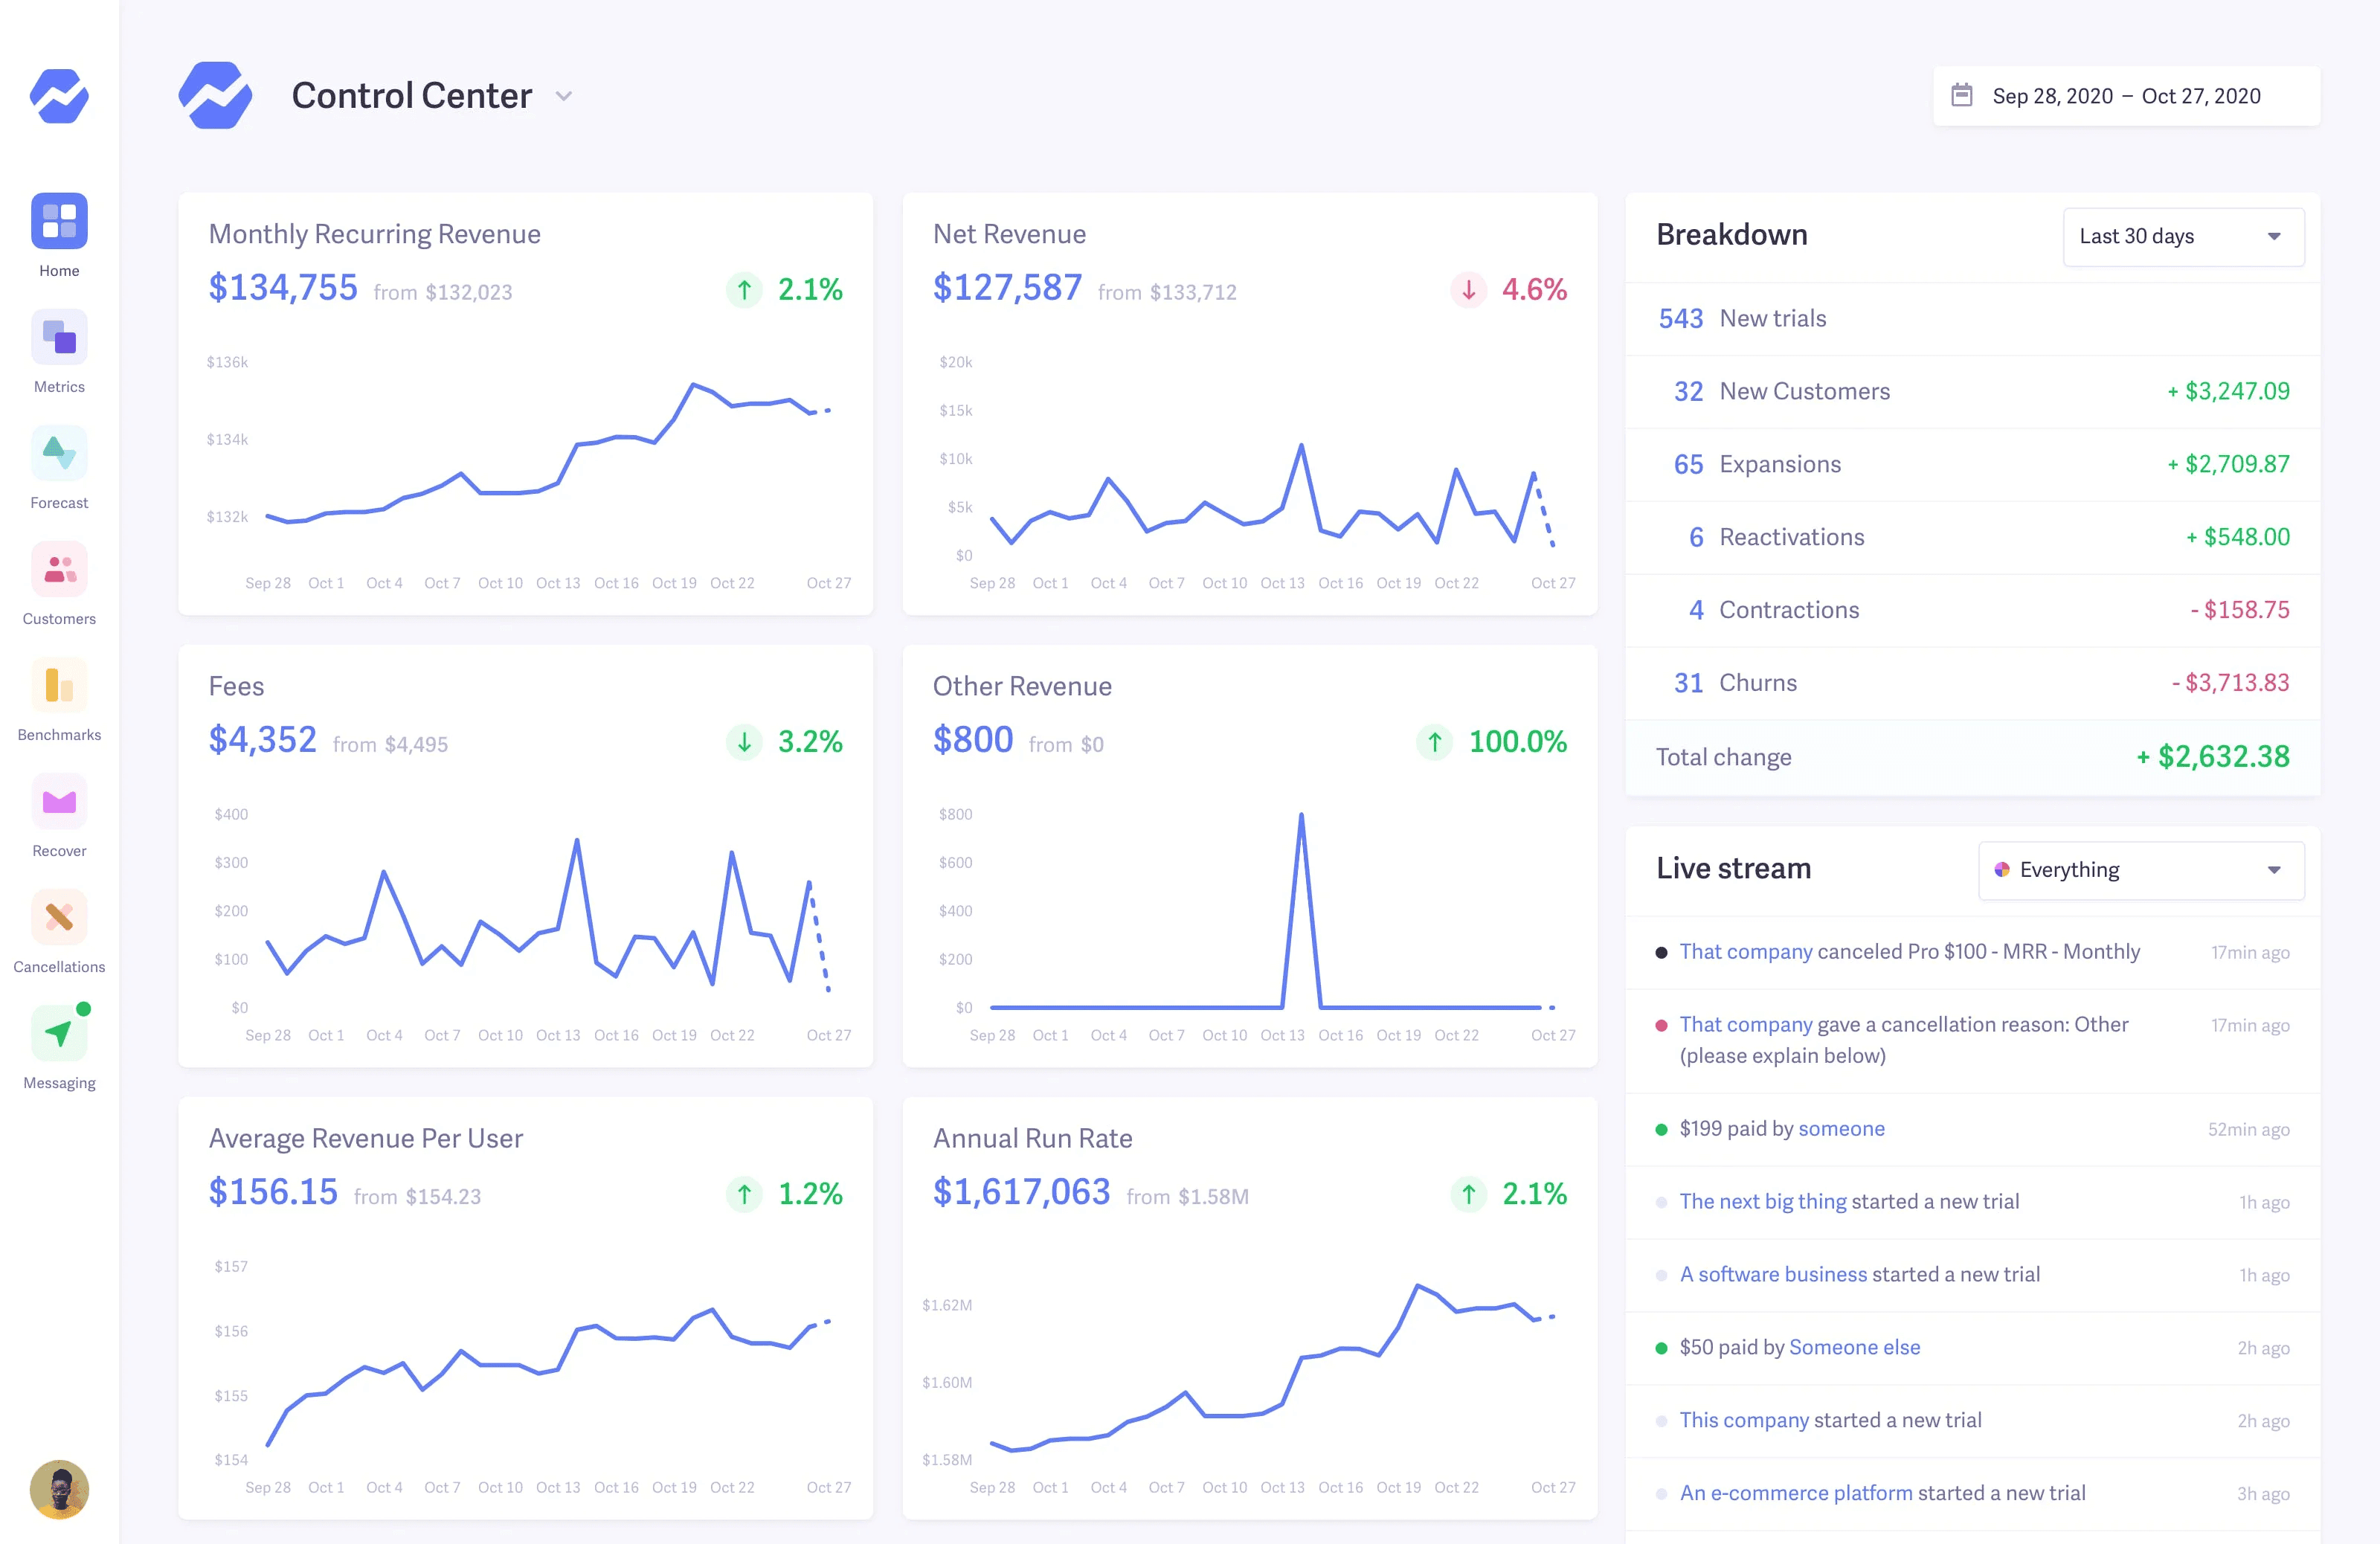
Baremetrics provides insights and analytics for businesses using payment platforms like Stripe, Recurly, and others. It offers simple integration that requires a little development work to get the desired financial analytics and reports. Best suited for subscription-only businesses that primarily use Stripe as their payment processor.
ChartMogul
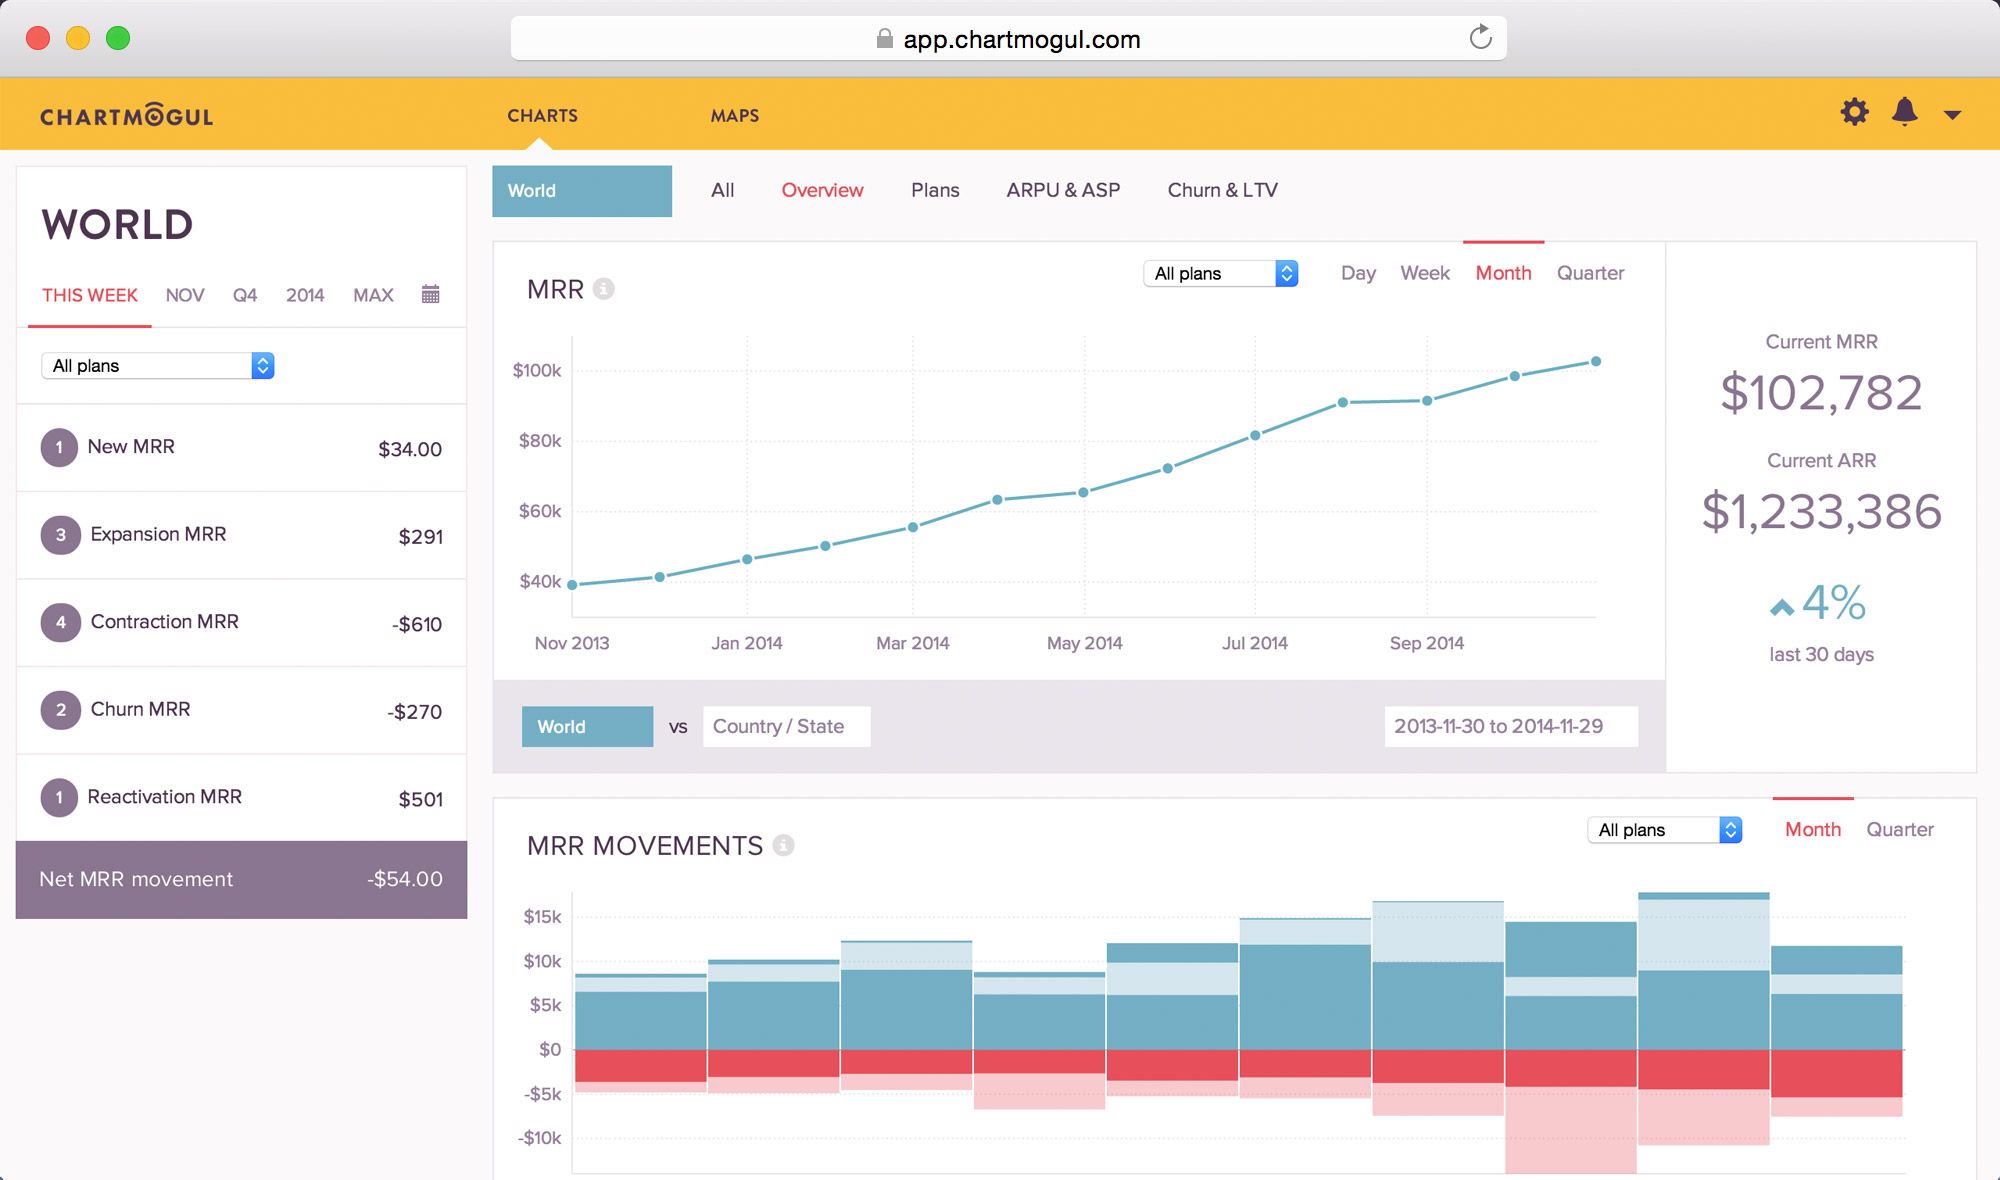
ChartMogul offers an in-depth MRR overview for your business analysts to enable diligent decision-making. With integrations to different payment gateways, ChartMogul offers detailed analytics solutions for subscription businesses looking for revenue recognition reporting.
MRR.io
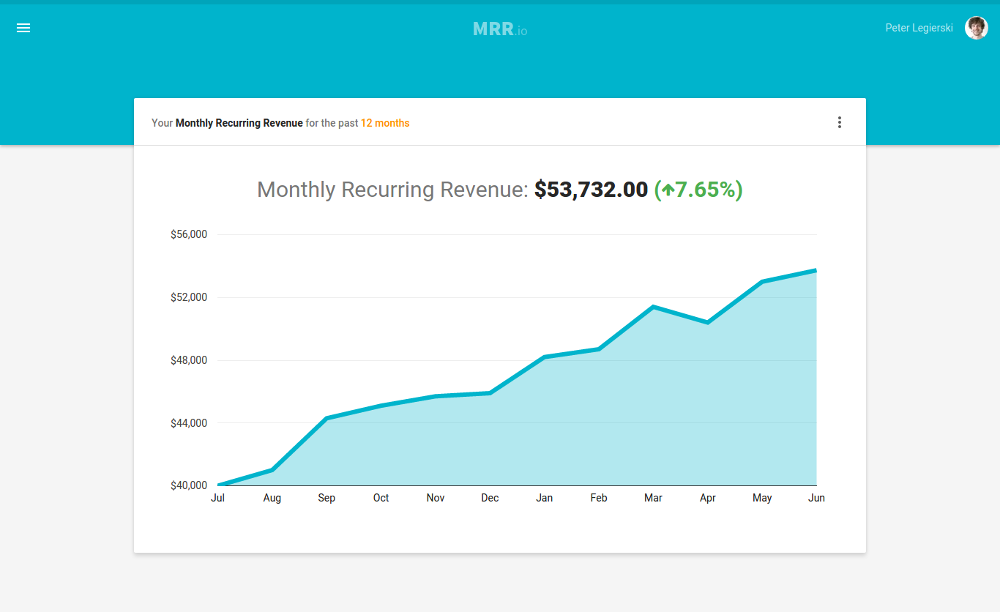
MRR.io is a lightweight reporting tool focused on subscription metrics. It connects to Stripe and provides a clean dashboard for tracking MRR, churn, and customer growth — a practical option for early-stage SaaS businesses that need basic subscription reporting without a heavy setup.
Why Putler is the best stripe reporting tool for growing businesses
Each of the tools above solves part of the problem. But most of them share the same fundamental limitation as Stripe itself: they only see what goes through one payment source.
If your business takes payments through Stripe and PayPal, runs a WooCommerce store, and operates across multiple currencies — none of those tools give you a single, accurate view of what’s actually happening. That’s the exact gap Putler was built to fill.
Putler is a great choice for alternative Stripe reporting that lets you get detailed analytical reports and comprehensive insights to track your business performance closely. Given the accuracy and the wide range of metrics it offers, Putler is popularly recommended for growth-oriented business analytics and reporting.
Compared to ChartMogul and Baremetrics, it offers a larger number of direct integrations along with features like instant refunds, RFM analysis, customer analysis, subscription management, 200+ metrics, multiple currency support, inbound API, and more, making Putler a widely recommended Stripe reporting tool.
For businesses also selling through WooCommerce with Stripe integration, Putler consolidates both data sources into a single dashboard — eliminating the need to switch between platforms.
Here are some key benefits that Putler offers, making it an ideal Stripe reporting tool for your growing business:
- Integration with Google Analytics:
With Putler, you can not only keep an eye on financial metrics but also get useful insights about visitors via Google Analytics that are crucial for the growth and relevance of your business.
Putler not only integrates with Google Analytics, but it also has its very own privacy-friendly web analytics solution that brings the most vital website analytics data onto one page. Combining Stripe metrics with Google Analytics and Putler Web Analytics lets you crack some breaking insights to fuel growth.
- One-stop results:
No need to switch between multiple accounts to track individual data and manually combine it for a total picture. Putler provides your entire data combined in one place for better analysis. Here’s how you can make the most out of Putler.
- Aggregation:
Putler fetches data from your multiple Stripe accounts, other payment gateways, different shopping carts, various currencies, and your Google Analytics. It then cleans and enriches this data to offer you deep business analytics, insights, and reports in a single user-friendly dashboard.
- Flexible:
Putler is flexible. You can choose to see a consolidated view of all your data sources or view each of the reports individually. This keeps all analytics data in a single place, making it easy for you to compare and analyse performance of your products, sales, orders, and customers over any given time period, seamlessly.
- Multi-dimensional analysis:
Putler offers in-depth analytics and reporting for multi-dimensional business analysis with 200+ metrics, trends, and reports covering product, orders, customer, and sales analytics. This helps the business build integral strategies that result in cumulative growth.
Practical use cases: leverage Putler’s Stripe analytics to grow your business
You can utilise Putler’s Stripe analytics to ensure the growth of your online business through the following reports that give you well-rounded insights.
Customer segmentation using RFM analysis
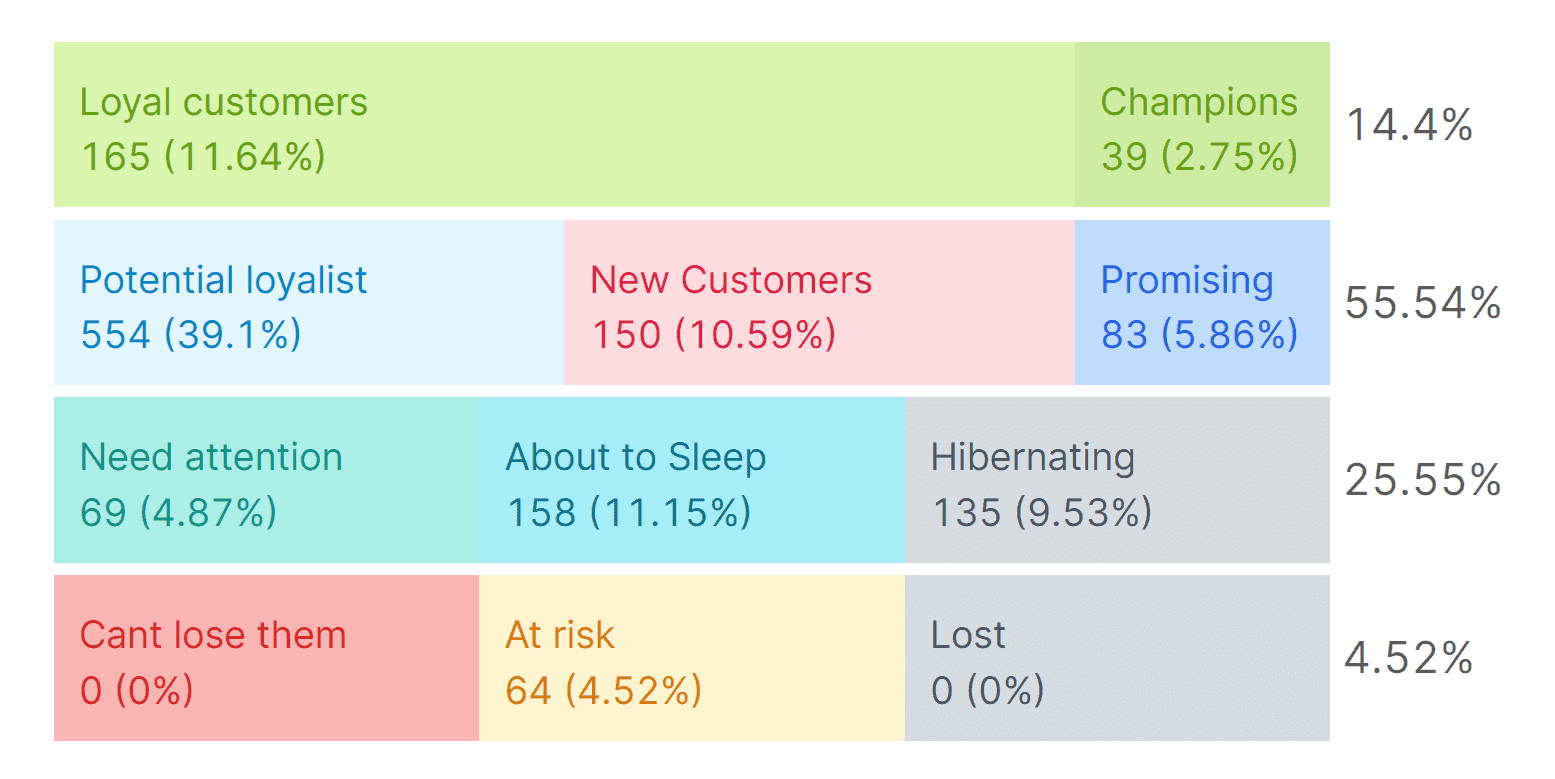
Putler segments your customers based on their buying behaviour.
This powerful segmentation technique is called RFM (Recency-Frequency-Monetary) segmentation. With this, you can define who your most recent buyers are, who purchases from you most frequently, and who has contributed the most to your business revenue.
This gives you a clear understanding of the popularity of your products among your target audience and your customer demographics. It can help drive growth through targeted marketing campaigns and product promotions.
Report forecasts using the Time Machine
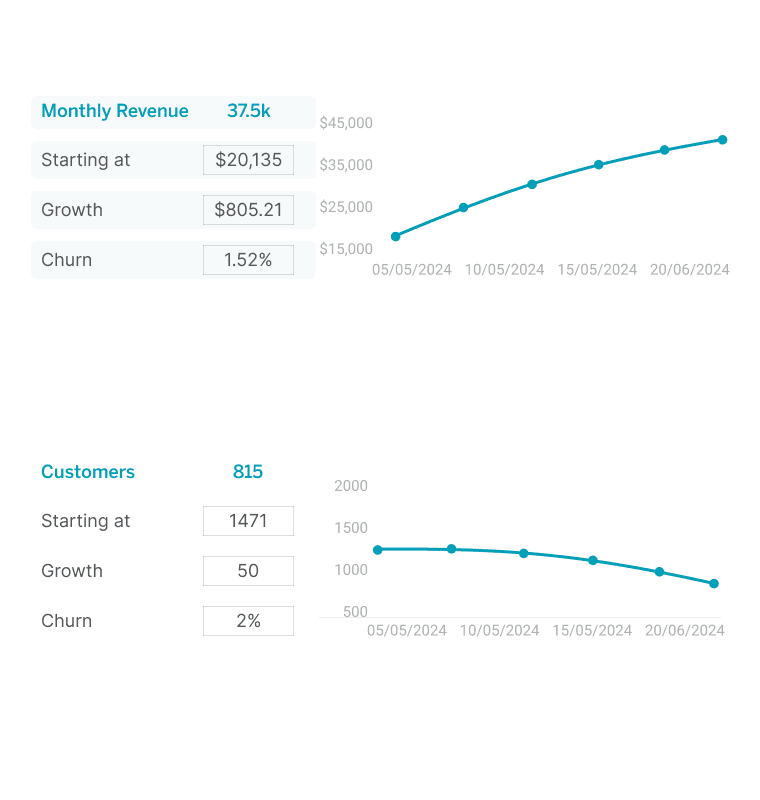
With Putler, you can not only get detailed insights and metrics based on your data history but also get future prediction reports and forecasts using the Time Machine feature. These projections on revenue and customers make planning future operations considerably easier, leading the way toward growth.
You can leverage the power of analytics and multi-dimensional metrics with Putler to get comprehensive insights that help formulate strategies to decode growth at its best.
Getting more from your Stripe reporting
Stripe is an excellent payment processor. Its built-in reporting covers the basics well and for early-stage businesses, it’s often all you need. But as your business grows — more payment gateways, more currencies, more subscription complexity — the gaps become harder to ignore.
The right approach is to use Stripe’s native reports for what they do well: daily transaction tracking, reconciliation, and QuickBooks exports. Then bring in a dedicated stripe reporting tool when you need the fuller picture: cross-gateway consolidation, customer segmentation, revenue forecasting, and multi-dimensional analytics.
That’s exactly what Putler is built for. Connect your Stripe account, your other payment gateways, and your store — and get a single, clean, accurate view of your entire business in one place.
FAQs
What metrics are calculated in Stripe?
Stripe calculates a range of essential metrics including revenue, transaction volume, average order value, customer acquisition cost, churn rate, MRR, ARR, and failed payment rates. With Putler, a powerful analytics tool for Stripe, you can access these metrics alongside deeper insights covering customer behaviour, product performance, and subscription health.
How do I get my reports from Stripe?
Log in to your Stripe account and navigate to the Reports section in the left sidebar. From there, select your report type, set your date range and timezone, and download as a CSV. For recurring needs, use the Schedule option to receive reports automatically on a daily, weekly, or monthly basis. For more comprehensive reporting beyond what Stripe provides natively, Putler integrates directly with your Stripe account and gives you advanced analytics without the manual export process.
How do I get a Stripe balance report?
Go to Reports in your Stripe dashboard and select the Balance tab. Use the date range controls at the top to set your period. The Balance summary section shows your starting and ending balances for that period along with a summary of your account activity. Download as CSV for use in your accounting system.
Does Stripe automatically tax?
By default, Stripe does not calculate taxes. You need to configure your tax settings in the Stripe Dashboard. Once set up, Stripe Tax automatically calculates the correct tax rate based on your customer’s location.
Can I connect Stripe to Google Analytics?
Yes, you can connect Stripe to Google Analytics to get a holistic view of your online business. By integrating these two platforms, you can track Stripe transactions alongside your website data to understand the full customer journey from acquisition to conversion. Putler offers seamless integration with both Stripe and Google Analytics. Putler also has its own privacy-friendly web analytics solution built in.
What is the difference between Stripe Sigma and standard stripe reports?
Standard Stripe reports cover balance transactions, payout reconciliation, and basic subscription metrics, available free from your dashboard. Stripe Sigma is a paid SQL-powered analytics environment that lets you write custom queries and build reports tailored to your exact needs.
Does Stripe reporting support multiple currencies?
Stripe can process payments in multiple currencies, but its reporting is organised by settlement currency, meaning you see separate reports for each currency rather than one consolidated view.